FTSE for Friday: is FTSE 100 really heading to 11,000?
Amid concerns about the sustainability of a ceasefire in the Middle East, independent analyst Alistair Strang studies his charts for signs of optimism.
10th April 2026 07:49
by Alistair Strang from Trends and Targets
Rather a few journalists have described current events on the FTSE 100 as a “market correction”, “a steep drop”, “a reversal of fortunes”, and even “part of a global sell-off”. The chart below, from our perspective, is utterly fascinating, showing all the various dance steps since 2001 with proper reversals displayed in detail. The FTSE recently falling to levels not seen since a few months ago doesn’t really comprise circumstances of disaster.
- Invest with ii:Open a Stocks & Shares ISA | Top ISA Funds | Transfer your ISA to ii
There is something potentially really important – again, from our perspective. It’s the thick green line at 10,574 points, utterly unexpected as a level at which the FTSE 100 should be worth paying attention to. This number is quite absurd, calculating from movements generated since 2001, a quite silly 25 years ago.
To cut a 25-year-old story short, the highest the FTSE 100 should have been able to achieve was 10,574 points and, normally, we would anticipate some turbulence at such a ridiculous level. What’s crazy is this logic appears to have worked out, the market solidly closing above 10,574, retreating below the target level, even doing a dinky little backtest of the target (circled on chart extract) and, in the last couple of sessions, once again closing above 10,574 points.
In addition, the level of the FTSE 100 managed above the level of the historic trend break around 10,375 in March, ticking a fairly important box for us now to anticipate even more FTSE gains.
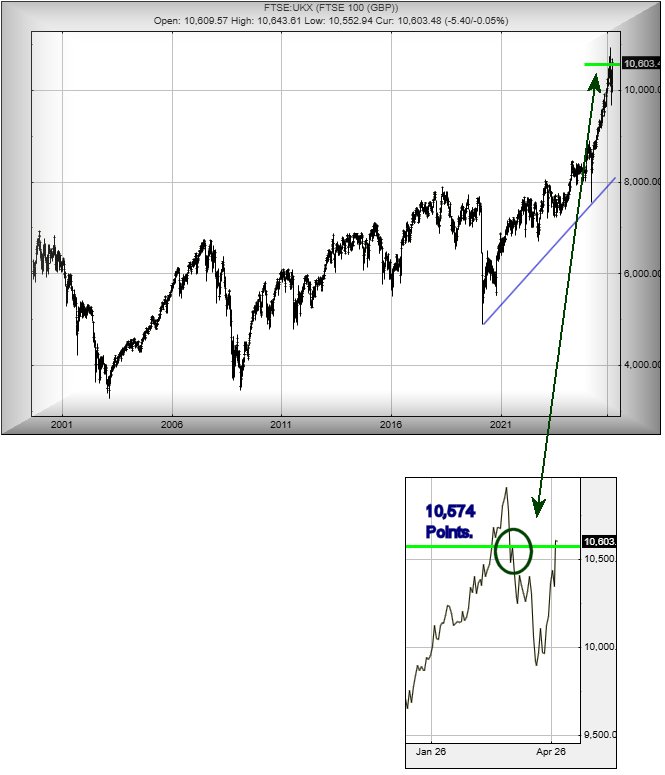
Source: Trends and Targets. Past performance is not a guide to future performance.
Our contribution to the headlines is to suggest the FTSE 100 is probably heading above 11,000 points next. Even from an immediate viewpoint, above 10,688 points calculates with potential of a lift to an initial 10,783 points with our secondary, if bettered, at 11,155 points.
While we’d ordinarily prefer to avoid proposing 500-point days for the FTSE, it’s quite difficult to ignore immediate market forces. If triggered, the tightest stop loss level works out at 10,550 points.
If things intend to follow the mood of Formula One fans, hating a month without races, below 10,090 points risks triggering reversals down to an initial 9,725 points with our secondary, if broken, at a less believable 9,331 points.
We’re not sold on the concept of reversals, quite the opposite. But unfortunately, the market has plenty of wriggle room in which it can pretend something useful is happening.
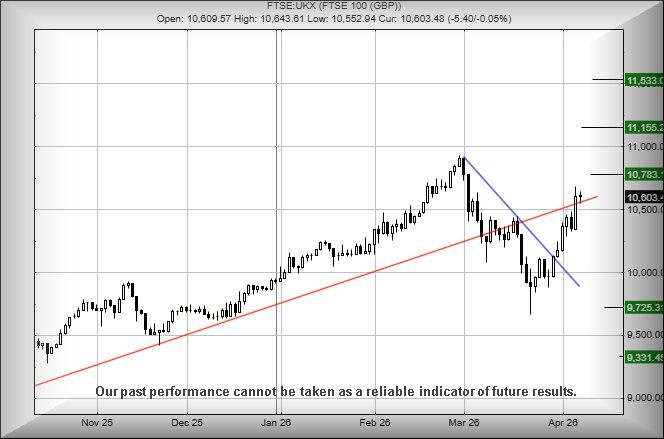
Source: Trends and Targets. Past performance is not a guide to future performance.
Alistair Strang has led high-profile and "top secret" software projects since the late 1970s and won the original John Logie Baird Award for inventors and innovators. After the financial crash, he wanted to know "how it worked" with a view to mimicking existing trading formulas and predicting what was coming next. His results speak for themselves as he continually refines the methodology.
Alistair Strang is a freelance contributor and not a direct employee of Interactive Investor. All correspondence is with Alistair Strang, who for these purposes is deemed a third-party supplier. Buying, selling and investing in shares is not without risk. Market and company movement will affect your performance and you may get back less than you invest. Neither Alistair Strang or Interactive Investor will be responsible for any losses that may be incurred as a result of following a trading idea.
These articles are provided for information purposes only. Occasionally, an opinion about whether to buy or sell a specific investment may be provided by third parties. The content is not intended to be a personal recommendation to buy or sell any financial instrument or product, or to adopt any investment strategy as it is not provided based on an assessment of your investing knowledge and experience, your financial situation or your investment objectives. The value of your investments, and the income derived from them, may go down as well as up. You may not get back all the money that you invest. The investments referred to in this article may not be suitable for all investors, and if in doubt, an investor should seek advice from a qualified investment adviser.
Full performance can be found on the company or index summary page on the interactive investor website. Simply click on the company's or index name highlighted in the article.