FTSE for Friday: strong upward travel now possible
Independent analyst Alistair Strang has run his software again and come up with some fresh forecasts for both the near term and further out.
25th July 2025 07:48
by Alistair Strang from Trends and Targets

Our popular FTSE for Friday analysis encapsulates something so obvious we often forget to mention it! While we throw around trigger levels and targets, we should really emphasise that they’re not just for Friday. It's because when the FTSE 100 hit our trigger level (from last Friday), the movement to 9,075 still caught some users by surprise!
- Invest with ii:Open a Stocks & Shares ISA | Top ISA Funds | Transfer your ISA to ii
The bankable 79 points, while successful, still managed to take three days to achieve our upper target, largely thanks to the FTSE’s parsimonious daily movements until Wednesday of this week. Come Thursday, things appear to have changed as the UK index has now wandered into a zone where fairly strong upward travel has now become possible. We’re working on the basis August shall kick due to July running out of steam on Thursday.
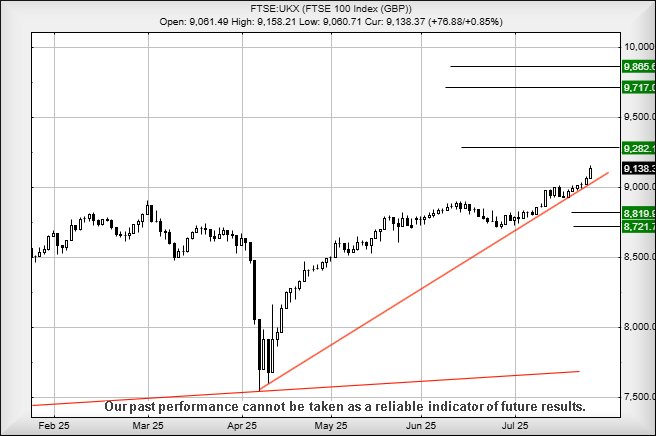
Should this be the case, it’s now the case that above 9,179 points looks like the next major trigger for the relatively near term. In this scenario, above such a trigger level calculates with the potential of a lift to an initial 9,282 points. Our longer-term secondary works out at an astounding 9,865 points, though our software warns of a hesitation potential at 9,717 points.
But if we discuss the chart, there is a fly in the ointment.
Drawing a boring red line from April of this year, the market has spent July slithering up a trend, carefully ensuring an uptrend hasn’t been broken. Should this engender optimism or should it warm of caution?
The blunt answer is we don’t know, there being no warning shots of dips below the trend line. Instead, market gains, while miserly, spent July paying homage to a trend line which makes absolutely no sense. If we treat the FTSE 100 as a share, the lack of any dips below the trend imply a “gotcha” drop may not be ahead. Instead, substantial gains should be anticipated.
However, below 9,041 points could prove alarming, risking triggering reversal toward an initial 8,816 points and a probable rebound. Our less likely secondary, should such a level break, works out at 8,721 points.
Source: Trends and Targets. Past performance is not a guide to future performance.
Alistair Strang has led high-profile and "top secret" software projects since the late 1970s and won the original John Logie Baird Award for inventors and innovators. After the financial crash, he wanted to know "how it worked" with a view to mimicking existing trading formulas and predicting what was coming next. His results speak for themselves as he continually refines the methodology.
Alistair Strang is a freelance contributor and not a direct employee of Interactive Investor. All correspondence is with Alistair Strang, who for these purposes is deemed a third-party supplier. Buying, selling and investing in shares is not without risk. Market and company movement will affect your performance and you may get back less than you invest. Neither Alistair Strang or Interactive Investor will be responsible for any losses that may be incurred as a result of following a trading idea.
These articles are provided for information purposes only. Occasionally, an opinion about whether to buy or sell a specific investment may be provided by third parties. The content is not intended to be a personal recommendation to buy or sell any financial instrument or product, or to adopt any investment strategy as it is not provided based on an assessment of your investing knowledge and experience, your financial situation or your investment objectives. The value of your investments, and the income derived from them, may go down as well as up. You may not get back all the money that you invest. The investments referred to in this article may not be suitable for all investors, and if in doubt, an investor should seek advice from a qualified investment adviser.
Full performance can be found on the company or index summary page on the interactive investor website. Simply click on the company's or index name highlighted in the article.