FTSE for Friday: trend breaks and new forecasts
Independent analyst Alistair Strang explains a 'teachable moment' and reveals what his charts tell us about FTSE 100 potentials.
5th September 2025 07:53
by Alistair Strang from Trends and Targets

The FTSE 100 is currently exhibiting a “teachable” moment, one worth paying attention to.
- Invest with ii:Open a Stocks & Shares ISA | Top ISA Funds | Transfer your ISA to ii
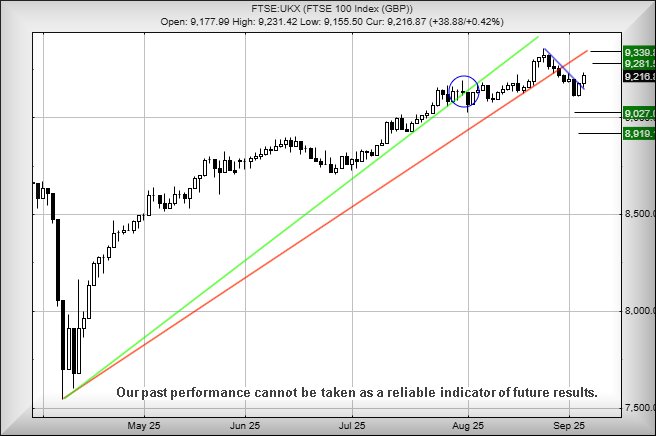
One of our tenets of faith relates to the level at which a price, index value, or whatever, breaks an uptrend (or a downtrend). Obviously, similar to absolutely everything relating to the stock markets, this theory will never be 100% reliable, but experience shows it’s right most of the time. There are a couple of rules:
1. If a price exceeds the level of an uptrend break, it becomes exceedingly likely the trend break was “fake” and gains can be expected. In the case of the Blue circled area on the chart at the start of August, the uptrend broke at 9,132 points. Within a couple of sessions, the market exceeded the trend break level, eventually achieving the recent high of 9,357 points. This also proved the convincing looking green uptrend was utterly fake!
2. There’s another situation which occurs when a price breaks below an uptrend then regains the trend shortly thereafter. This is a big deal, usually suggesting some strong movement should be anticipated.
The recent break of the Red uptrend at 9,238 points theoretically dumped the FTSE 100 into a zone where we should anticipate weakness to 9,027 points with our secondary, if broken, a probable bottom at 8,919 points. Our inclination is not to take this terribly seriously just yet, unless of course the FTSE stumbles below the recent low of 9,108 points.
More likely, it feels like index gains should be possible in the near term, movement above 9,234 points allegedly capable of triggering a visit to an initial 9,281 points.
Our longer-term secondary calculates at 9,339 points, but from our perspective the attraction shall occur if the index manages to close a session above 9,238 points. This should open the doors for a cycle to commence to above 9,700 points.
Have a good weekend.
Source: Trends and Targets. Past performance is not a guide to future performance.
Alistair Strang has led high-profile and "top secret" software projects since the late 1970s and won the original John Logie Baird Award for inventors and innovators. After the financial crash, he wanted to know "how it worked" with a view to mimicking existing trading formulas and predicting what was coming next. His results speak for themselves as he continually refines the methodology.
Alistair Strang is a freelance contributor and not a direct employee of Interactive Investor. All correspondence is with Alistair Strang, who for these purposes is deemed a third-party supplier. Buying, selling and investing in shares is not without risk. Market and company movement will affect your performance and you may get back less than you invest. Neither Alistair Strang or Interactive Investor will be responsible for any losses that may be incurred as a result of following a trading idea.
These articles are provided for information purposes only. Occasionally, an opinion about whether to buy or sell a specific investment may be provided by third parties. The content is not intended to be a personal recommendation to buy or sell any financial instrument or product, or to adopt any investment strategy as it is not provided based on an assessment of your investing knowledge and experience, your financial situation or your investment objectives. The value of your investments, and the income derived from them, may go down as well as up. You may not get back all the money that you invest. The investments referred to in this article may not be suitable for all investors, and if in doubt, an investor should seek advice from a qualified investment adviser.
Full performance can be found on the company or index summary page on the interactive investor website. Simply click on the company's or index name highlighted in the article.