Gold: another hard look at the soft metal's potential
The yellow metal seems almost unstoppable as it races closer to $4,000. Here's what independent analyst Alistair Strang's charts suggest might happen.
1st October 2025 07:48
by Alistair Strang from Trends and Targets

There is an element of confusion about the price of gold. It has almost gone higher than arithmetically possible, at least from our perspective.
- Invest with ii:Open a Stocks & Shares ISA | Top ISA Funds | Transfer your ISA to ii
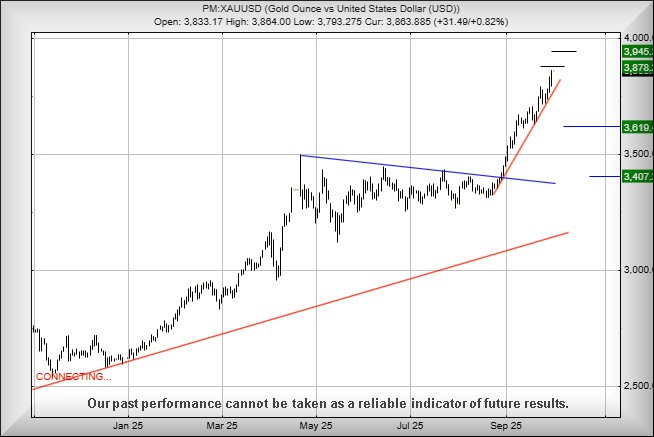
When we reviewed the metal in July, we showed $3,713 at the top of the chart, a difficult ambition to justify as the metal was around $3,387 when we produced our report.
With it currently around $3,860, we’ve been looking hard at movements since it managed to exceed our $3,713 target, this always being a horrible scenario as we hate using such a short-term influence to predict the future.
Currently, above $3,864 for gold looks like it holds the potential for movement now to an initial $3,878 with our longer-term secondary, if exceeded, at a rather less confident sounding $3,945.
At this point, we’d be inclined toward suspicion, expecting market gremlins to miraculously propel the price to the $4,000 level and thus, create an impression $4,000 has been anointed as the highest level gold shall achieve.
Should this prove to be the case, it would tend to imply some market manipulation was taking place and it’d be sensible for a bunch of folk to open short positions, anticipating $4,000 being a level which shall prove as impermeable as a politicians brain. Once sufficient number of traders open short positions at the $4,000 level, it’d be a wizard wheeze for the metal to bubble higher yet again, tripping a bunch of very profitable stop-loss positions.
We tend to be quite cynical about this sort of thing, the same playbook followed on many occasions with many different instruments. Should the scenario run true to form, once the price spends a little time above the $4,000 level, at such a point sharp reversals can be anticipated. Life for gold is certainly looking interesting.
Nearer term, if things intend to go wrong for the yellow metal, below the immediate Red trend at $3,756 could be a problem, calculating with the potential of triggering reversals to an initial $3,619 with our secondary, if broken, at $3,407 and an almost certain rebound, judging by the visuals.
Source: Trends and Targets. Past performance is not a guide to future performance.
Alistair Strang has led high-profile and "top secret" software projects since the late 1970s and won the original John Logie Baird Award for inventors and innovators. After the financial crash, he wanted to know "how it worked" with a view to mimicking existing trading formulas and predicting what was coming next. His results speak for themselves as he continually refines the methodology.
Alistair Strang is a freelance contributor and not a direct employee of Interactive Investor. All correspondence is with Alistair Strang, who for these purposes is deemed a third-party supplier. Buying, selling and investing in shares is not without risk. Market and company movement will affect your performance and you may get back less than you invest. Neither Alistair Strang or Interactive Investor will be responsible for any losses that may be incurred as a result of following a trading idea.
These articles are provided for information purposes only. Occasionally, an opinion about whether to buy or sell a specific investment may be provided by third parties. The content is not intended to be a personal recommendation to buy or sell any financial instrument or product, or to adopt any investment strategy as it is not provided based on an assessment of your investing knowledge and experience, your financial situation or your investment objectives. The value of your investments, and the income derived from them, may go down as well as up. You may not get back all the money that you invest. The investments referred to in this article may not be suitable for all investors, and if in doubt, an investor should seek advice from a qualified investment adviser.
Full performance can be found on the company or index summary page on the interactive investor website. Simply click on the company's or index name highlighted in the article.