Happy times ahead for Barclays shares?
An impressive rebound from the Iran war sell-off has triggered independent analyst Alistair Strang's interest in the retail bank's share price. Here what his software says about price potentials.
20th April 2026 07:25
by Alistair Strang from Trends and Targets
Without any surprise, the FTSE 100 managed to waste everyone’s time on Friday, frittering around while rain fell here in Argyll in record quantities, while other world markets were experiencing a day of 2% gains. Again.
- Invest with ii:Open a Stocks & Shares ISA | Top ISA Funds | Transfer your ISA to ii
The FTSE’s moribund behaviour is something we hope shall prove to be a fairly short term affliction, hopefully cured once navigation resumes in the Straits of Hormuz.
However, there remains optimism for some decent FTSE 100 acceleration, such an event obviously holding a high probability of Barclays (LSE:BARC) stirring up memories from 2009.
To be fair, the share price is already cruising in an area where our rule of thumb deems a distant 737p as exerting a future influence, though goodness knows how long it would take. Unfortunately, the share price only needs to close below 432p for us to glare at the tea leaves and revisit the numbers for the future.
At present, above 456p is supposed to trigger gains in the direction of an initial 468p with our secondary, if bettered, at 506p and the possibility of the share price entering the land of Big Picture miracles.
While achieving 506p shall challenge the downtrend since 2007, this is liable to become a truly important era for the retail bank's share price, as while it’s possible to highlight various price levels as potential problems on the way up, the strength of the share price when this Blue downtrend commenced is liable to make a future 737p a very viable ambition.
Should things intend to go wrong for Barclays – or at least enact a slowdown – below 432p would certainly present a problem, opening up the concept of reversal to an initial 408p with our secondary, if broken, at 353p and the potential for a bounce. At present, we’re more focussed on happier days ahead.
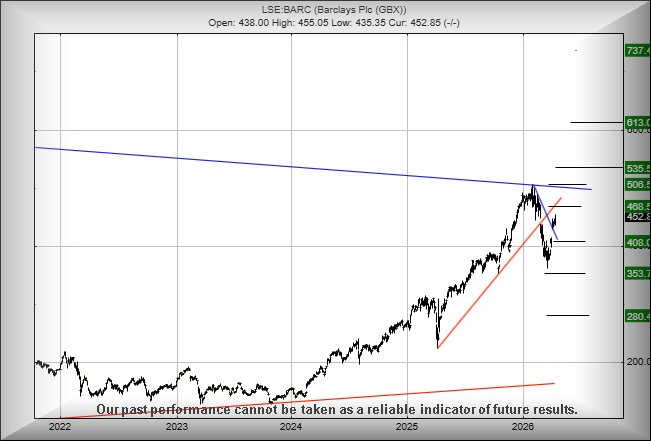
Source: Trends and Targets. Past performance is not a guide to future performance. Important: Trends and Targets charts only incorporate official share count consolidations, ignoring rights issues where investors have a choice as to whether to participate.
Alistair Strang has led high-profile and "top secret" software projects since the late 1970s and won the original John Logie Baird Award for inventors and innovators. After the financial crash, he wanted to know "how it worked" with a view to mimicking existing trading formulas and predicting what was coming next. His results speak for themselves as he continually refines the methodology.
Alistair Strang is a freelance contributor and not a direct employee of Interactive Investor. All correspondence is with Alistair Strang, who for these purposes is deemed a third-party supplier. Buying, selling and investing in shares is not without risk. Market and company movement will affect your performance and you may get back less than you invest. Neither Alistair Strang or Interactive Investor will be responsible for any losses that may be incurred as a result of following a trading idea.
These articles are provided for information purposes only. Occasionally, an opinion about whether to buy or sell a specific investment may be provided by third parties. The content is not intended to be a personal recommendation to buy or sell any financial instrument or product, or to adopt any investment strategy as it is not provided based on an assessment of your investing knowledge and experience, your financial situation or your investment objectives. The value of your investments, and the income derived from them, may go down as well as up. You may not get back all the money that you invest. The investments referred to in this article may not be suitable for all investors, and if in doubt, an investor should seek advice from a qualified investment adviser.
Full performance can be found on the company or index summary page on the interactive investor website. Simply click on the company's or index name highlighted in the article.