How Sound Energy shares could break higher
Sound shares avoided a sharp decline, but does it imply hidden strength? Our chartist has the answer.
14th March 2019 09:56
by Alistair Strang from Trends and Targets
Sound shares avoided a sharp decline, but does it imply hidden strength? Our chartist has the answer.

It's now been a year since we inherited two cats, enjoying their ongoing phoney war with our dogs. Who knew cats will starve to death if not fed every few hours? Entering the kitchen in full stealth mode doesn't help - within seconds, the cats are pretending famine. Some share prices, amazingly, will behave similarly!
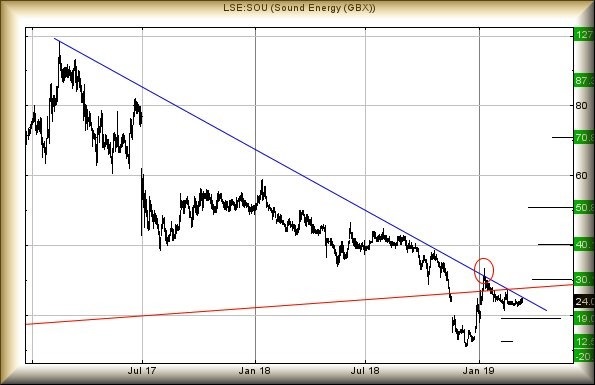
Sound Energy (LSE:SOU) are a case in point. When we last reviewed it back in January, we proposed a scenario when, if it moved below 24p, there was a chance of it bottoming at 19p. Instead, the price moved down to 21p and bounced, very slightly. This is the "so you were not actually starving, just wanted some attention" part of price movements, thanks to the share price not showing real weakness.
Since this charade, Sound has been cheerfully paddling along while actually, similar to a cat, doing nothing useful. We do have a question though; it had a chance to drop and failed to embrace it. Does this actually imply hidden strength?
The downtrend for the last few years has been fairly well defined with the share price once again squirming, like a malnourished cat, against the blue downtrend.
We remain tainted with optimism, due to the circled break above blue back at the start of the year, a movement which proved the trend line may not be sacred. It's perhaps worth mentioning this share price is quite dangerous as until such time it closes above blue (presently 25p), it's trading in a region where ultimate bottom calculates at a completely impossible minus 20p.
For now, we shall be inclined to view intraday traffic above 26.7p (not a spike upward in the opening seconds of trade) as signalling a true attempt to break free, this looking capable of provoking a visually believable 30p initially. If exceeded, our longer-term secondary calculates at 40p.
Otherwise, until it betters the trend, the risk remains of shuffles below 21p allowing for an initial 19p with secondary, if broken, at a potential solid bounce point of 12.5p. To be blunt, if it failed to bounce at 12.5p, the implications stink worse than cat food.
Source: Trends and Targets Past performance is not a guide to future performance
Alistair Strang has led high-profile and "top secret" software projects since the late 1970s and won the original John Logie Baird Award for inventors and innovators. After the financial crash, he wanted to know "how it worked" with a view to mimicking existing trading formulas and predicting what was coming next. His results speak for themselves as he continually refines the methodology.
Alistair Strang is a freelance contributor and not a direct employee of Interactive Investor. All correspondence is with Alistair Strang, who for these purposes is deemed a third-party supplier. Buying, selling and investing in shares is not without risk. Market and company movement will affect your performance and you may get back less than you invest. Neither Alistair Strang or Interactive Investor will be responsible for any losses that may be incurred as a result of following a trading idea.
These articles are provided for information purposes only. Occasionally, an opinion about whether to buy or sell a specific investment may be provided by third parties. The content is not intended to be a personal recommendation to buy or sell any financial instrument or product, or to adopt any investment strategy as it is not provided based on an assessment of your investing knowledge and experience, your financial situation or your investment objectives. The value of your investments, and the income derived from them, may go down as well as up. You may not get back all the money that you invest. The investments referred to in this article may not be suitable for all investors, and if in doubt, an investor should seek advice from a qualified investment adviser.
Full performance can be found on the company or index summary page on the interactive investor website. Simply click on the company's or index name highlighted in the article.