The important levels for gold investors to note down
Deciding if gold can challenge this target level following recent reversal is fairly straightforward.
19th November 2019 08:47
by Alistair Strang from Trends and Targets
Deciding whether gold can challenge this target level following recent reversal is fairly straightforward.

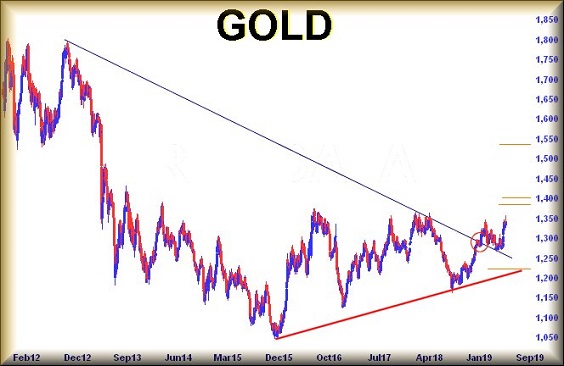
Gold (Comex:XAUUSD)
Our last glance at the yellow stuff in June proved a success as we mapped a movement from $1,357 up to $1,537, weird with the numbers just changing order!
Importantly, our initial target was bettered for a session or two, resulting a situation where future optimism is possible and almost assured.
- Gold price could rally if this happens
- There's a way to invest in gold via this ii Super 60 recommended fund
Unsurprisingly, despite the metal bettering our $1,537 ambition, it was a pretty major target level, one at which we'd expected some hesitation, and the market is currently obliging.
The immediate situation is fairly straightforward, with gold prices seen as suffering due to the strength of indices. We've a suspicion this shall prove a load of tosh at some point soon, once the price of gold exhausts reversal pressures.
Apparently, if gold now trades below $1,454 dollars, it should experience reversal to an initial $1,429 with secondary, if broken, calculating at a bottom of $1,376.
We hope for a serious bounce if $1,376 makes an appearance. Ideally, in fact, any bounce should occur somewhere around the $1,400 mark, "proving" strength in the price and once again entering a cycle which should again challenge the $1,537 level.
If $1,537 is bettered, despite hesitation appearing visually probable at the $1,550 level, it should enter a growth cycle to $1,603 initially with secondary, if bettered, calculating at $1,674 dollars.
Due to the $1,674 once again being a major ambition, some hesitation appears very probable around such a level.
To summarise, we suspect the current reversal cycle on gold should bottom around the $1,400 dollar mark.
If opening a "blind long" at such a level, stop needs be just below $1,376. For our future thoughts to prove correct, any bounce from $1,400 exceeding $1,537 is liable to prove quite profitable, until $1,674 makes an appearance.
The reason we're being a little hysterical about the $1,376 level is simple. Below such a point introduces the potential of $1,208 making itself known as "bottom".
Source: Trends and Targets Past performance is not a guide to future performance
Alistair Strang has led high-profile and "top secret" software projects since the late 1970s and won the original John Logie Baird Award for inventors and innovators. After the financial crash, he wanted to know "how it worked" with a view to mimicking existing trading formulas and predicting what was coming next. His results speak for themselves as he continually refines the methodology.
Alistair Strang is a freelance contributor and not a direct employee of Interactive Investor. All correspondence is with Alistair Strang, who for these purposes is deemed a third-party supplier. Buying, selling and investing in shares is not without risk. Market and company movement will affect your performance and you may get back less than you invest. Neither Alistair Strang or Interactive Investor will be responsible for any losses that may be incurred as a result of following a trading idea.
These articles are provided for information purposes only. Occasionally, an opinion about whether to buy or sell a specific investment may be provided by third parties. The content is not intended to be a personal recommendation to buy or sell any financial instrument or product, or to adopt any investment strategy as it is not provided based on an assessment of your investing knowledge and experience, your financial situation or your investment objectives. The value of your investments, and the income derived from them, may go down as well as up. You may not get back all the money that you invest. The investments referred to in this article may not be suitable for all investors, and if in doubt, an investor should seek advice from a qualified investment adviser.
Full performance can be found on the company or index summary page on the interactive investor website. Simply click on the company's or index name highlighted in the article.