NatWest’s chart is showing something important
9th August 2021 09:33
by Alistair Strang from Trends and Targets
Our charts expert has spotted some interesting elements in the bank’s share price movements.
When we last reviewed NatWest Group (LSE:NWG) three weeks ago, we made a point of showing how important it can be to study a share's closing price, in addition to viewing a screen full of pretty candles.
Amazingly, for a UK retail bank, everything started to make sense within days, a target was met, and yet another potential candle catastrophe is upon us.
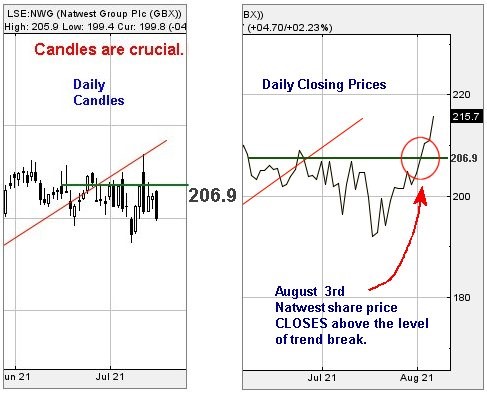
First, the chart extracts below. The red uptrend since September 2020 was broken in June, the trend break level being at 206.9p. We'd made a point, should the share price manage to close above the level of trend break, we could no longer regard the red uptrend as being viable.
On 3 August, NatWest share price closed the session at 207.4p, suggesting the historical break of the uptrend was no longer valid and instead, price growth was expected. Our initial target of 215p was successfully achieved in Friday 6 August.
Source: Trends and Targets. Past performance is not a guide to future performance
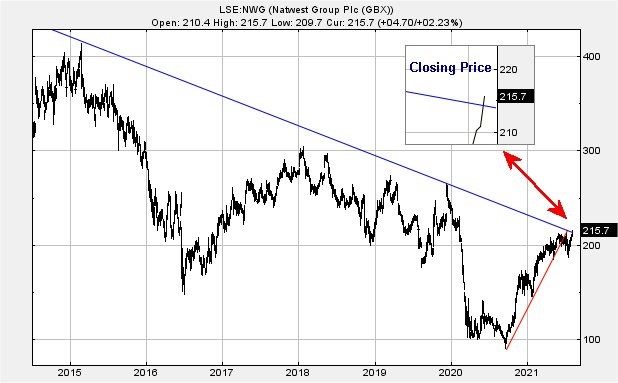
However, staying with our lesson on managing candles - and when to turn them off - it's very possible something more important occurred on Friday, given the point at which NatWest share price closed the session.
Shown below, there's a long-term blue downtrend and with the share price closing at 215.7p, the day was quite solidly above the historical downtrend, ticking a pretty important box, which is the first sign of optimism for the future. The share now needs close a session below 213.6p to give cause for concern.
Source: Trends and Targets. Past performance is not a guide to future performance
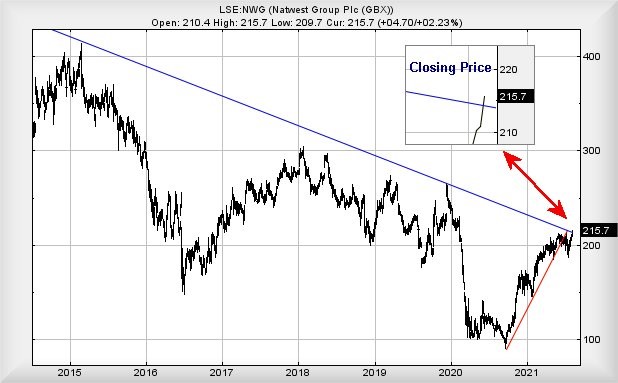
Finally, even from a near-term viewpoint, reasonable levels of hope appear possible. Above 216p now calculates with the potential of gains in the direction of an initial 226p with secondary, if exceeded, working out at a very possible 251p. In fact, from a big picture perspective, thanks to the share closing a session above the blue downtrend, we can now regard a long-term 324p as allegedly exerting a distant influence.
If it all intends go horribly wrong, the share price needs close a session below 193p, thus threatening a reversal cycle commencing down to 167p eventually.
Source: Trends and Targets. Past performance is not a guide to future performance
Alistair Strang has led high-profile and "top secret" software projects since the late 1970s and won the original John Logie Baird Award for inventors and innovators. After the financial crash, he wanted to know "how it worked" with a view to mimicking existing trading formulas and predicting what was coming next. His results speak for themselves as he continually refines the methodology.
Alistair Strang is a freelance contributor and not a direct employee of Interactive Investor. All correspondence is with Alistair Strang, who for these purposes is deemed a third-party supplier. Buying, selling and investing in shares is not without risk. Market and company movement will affect your performance and you may get back less than you invest. Neither Alistair Strang or Interactive Investor will be responsible for any losses that may be incurred as a result of following a trading idea.
These articles are provided for information purposes only. Occasionally, an opinion about whether to buy or sell a specific investment may be provided by third parties. The content is not intended to be a personal recommendation to buy or sell any financial instrument or product, or to adopt any investment strategy as it is not provided based on an assessment of your investing knowledge and experience, your financial situation or your investment objectives. The value of your investments, and the income derived from them, may go down as well as up. You may not get back all the money that you invest. The investments referred to in this article may not be suitable for all investors, and if in doubt, an investor should seek advice from a qualified investment adviser.
Full performance can be found on the company or index summary page on the interactive investor website. Simply click on the company's or index name highlighted in the article.