Oil share analysis: Is Cairn Energy due a bounce on this news?
25th October 2018 10:05
by Rajan Dhall from interactive investor
Financial markets analyst Rajan Dhall picks out the day's key industry news and runs the numbers to see what this share price might do next.

It seems each week we are seeing builds in storage levels in the US. Yesterday, the Energy Information Administration's (EIA) Crude Oil Inventories weekly data recorded a build of 6.346 million barrels vs the expected 3.694 million.
Not only that the American Petroleum Institute (API) report of weekly inventory levels of US crude oil showed a huge build of 9.880 million barrels vs the previous weeks reading of 2.100 million. The only saving grace is that production fell 300,000 barrels to 10.9 million barrels per day.
Today spot WTI is hovering around $66.60 per barrel after falling around 5% a couple of days ago.
Cairn Energy
Cairn Energy has this morning announced its Development and Exploitation Plan for the SNE field offshore Senegal has been submitted on schedule to the government of Senegal by the joint venture with approval targeted later this year.
That wasn't the only piece of good news as the company added that JV partner Woodside Energy has exercised its option to become operator of the SNE field development.
• Don't ignore sub-plots in Cairn Energy results
The field is set to be developed in a series of phases, with plans for 500 million barrels of oil and gross production of 100,000 barrels of oil per day with first oil targeted in 2022.
This is clearly a significant milestone for Cairn and Senegal holds bags of potential, although it's something the market is unwilling to factor much on Thursday. Cairn shares are a whisker higher in a falling market, yet remain close to one-year lows.
Chart analysis
Below is the weekly chart for Cairn Energy, and it's clear to see the company is in need of some good news. Although the strategy of the JV is risky, this looks like a big step in the right direction.
Price has recently broken the trendline dating back to 2016 to test the 180p level which was used as support in late to mid-2016.
Today we have seen a small rejection, and it remains to be seen if the market will push below. Next line of defence on the downside comes at the July support at around 165p.
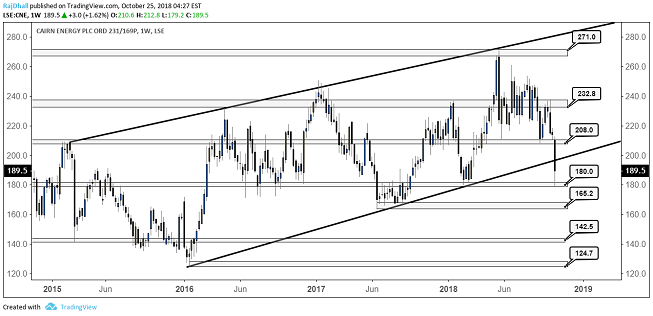
Source: TradingView Past performance is not a guide to future performance
Rajan Dhall is a freelance contributor and not a direct employee of interactive investor.
These articles are provided for information purposes only. Occasionally, an opinion about whether to buy or sell a specific investment may be provided by third parties. The content is not intended to be a personal recommendation to buy or sell any financial instrument or product, or to adopt any investment strategy as it is not provided based on an assessment of your investing knowledge and experience, your financial situation or your investment objectives. The value of your investments, and the income derived from them, may go down as well as up. You may not get back all the money that you invest. The investments referred to in this article may not be suitable for all investors, and if in doubt, an investor should seek advice from a qualified investment adviser.
Full performance can be found on the company or index summary page on the interactive investor website. Simply click on the company's or index name highlighted in the article.