The perfect place to diversify your portfolio
One of the financial world's most unloved regions, we look at sectors that are unique to Europe.
26th April 2019 15:06
This content is provided by Kepler Trust Intelligence, an investment trust focused website for private and professional investors. Kepler Trust Intelligence is a third-party supplier and not part of interactive investor. It is provided for information only and does not constitute a personal recommendation.
Material produced by Kepler Trust Intelligence should be considered a marketing communication, and is not independent research.
Currently one of the financial world's most unloved regions, we look at the sectors that are unique to Europe and how the persistent pessimism has presented attractive opportunities…
Nothing compares to EU
As with most people, we are sick of discussing Brexit's endless possible scenarios and how it might impact equity markets. The outlook is forever shifting, the large majority of "information" being pure conjecture.
Nevertheless, the political and economic backdrop means that Europe is now one of the most out of favour investment regions. In the open ended IA sector, Q3 and Q4 of last year saw total outflows of -£1.6 billion in Europe, relative to the US and Global sectors which saw inflows of £289 million and £114 million respectively.
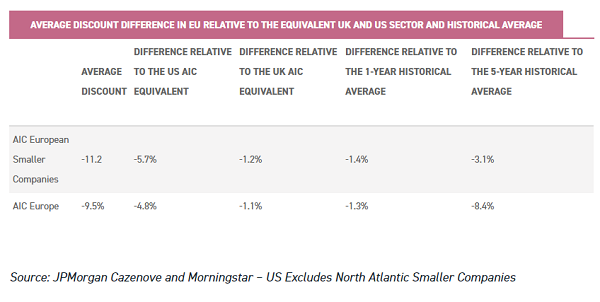
Only the UK saw greater outflows. The discounts on closed-ended funds also suggest an out-of-favour asset class.
As can be seen below, relative to both historical averages and global peers, European investment trusts are good value. In fact, Europe is even more out of favour than the UK, judging by discounts.
Not a basket case
Being able to pick up exposures on wide discounts and supercharge returns as those discounts close is one of the most exciting benefits of investing in closed-ended funds, so the fact Europe is so out of favour should be piquing interest.
In our view there are good fundamental reasons to have exposure to Europe over the long run.
Chief among these are the diversification benefits provided by the very different businesses that European stock markets provide relative to those available in the UK.
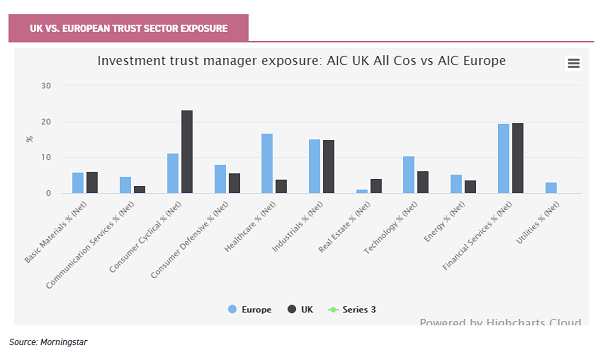
As we highlight in the graph below, there are some large differences between the sector exposures of UK-focused trusts relative to their counterparts in Europe.
UK-focused trusts are quite concentrated in consumer cyclicals, industrials and financial services.
In comparison, European managers are far more diversified. We would highlight in particular the higher exposures to healthcare and technology stocks in Europe, two sectors going through rapid and exciting change with the potential to generate high shareholder returns. We consider these exposures below, along with some interesting but more minor differences.
Healthcare
Looking at the average sector exposure for AIC Europe vs AIC UK All Companies, European stocks have over 10% more exposure to healthcare stocks.
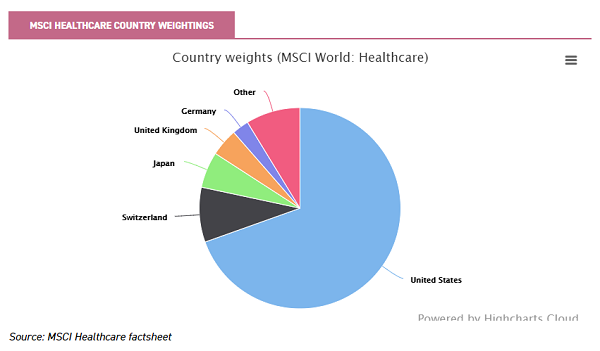
Globally, the industry is dominated by the US, and the MSCI World Healthcare factsheet shows that 68% of the industry sits there.
However, valuations in the Healthcare sector in the US are close to 25% greater. According to the MSCI USA Health Care Index, the average PE for a Health care company is 24x. In comparison, the average PE in in the MSCI Europe Health Care Index the average PE is 19x.
Europe is particularly strong in pharmaceutical companies, in fact, over 80% of healthcare companies in Europe are pharmaceutical businesses, with many key players being Swiss - indeed, half of the European healthcare industry is located in Switzerland.
Much of Switzerland's advantage in healthcare is due to the R&D ecosystem that has developed there.
For example, the Swiss bio-pharma industry employs around 150,000 people, directly or indirectly, contributing close to 6% of the country's GDP and 30% of the country's exports (Swiss Biotech 2018 report).
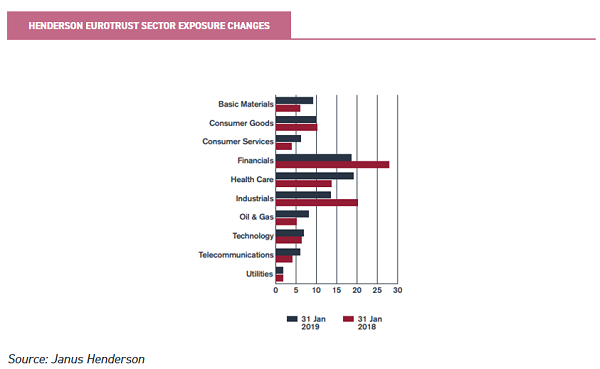
Henderson EuroTrust (LSE:HNE) has been increasingly taking advantage of this over the past year, as can be seen below in the increase in their weighting towards healthcare. The trust, now led by James Ross, has close to 20% of its portfolio in healthcare, principally pharmaceuticals.
This is five times the average of trusts in the UK All Companies sector (4%), where no trust even has double digit exposure. Henderson EuroTrust's two largest holdings are Roche (XETRA:RHO) (4.7%) and Novo Nordisk A/S (XETRA:NOVC) (4.4%), both of which sit in the ten largest pharmaceutical companies in the world.
James likes to focus on companies with high returns on invested capital, identifying companies with a strong market position, strong balance sheet, consistent growth and high-quality management with a sound strategy.
Switzerland is also considered a hub for the technology employed in healthcare ("med-tech"). Of the total workforce, 1.4% of Swiss work in the medical technology sector (Berninvest 2018), and in absolute terms considerably more than in both Germany and the UK, despite their larger populations.
Alongside this, Swiss companies continue to develop technology at greater rates, principally due to their tendency of allocating revenue and resources back into the company, as opposed to paying out dividends like in the UK.
Research from Monerail (2018) showed that Swiss MedTech manufacturers and suppliers, depending on age and size of the company, spend up to 30% of their turnover on R&D, while the global average is 6-7%.
BlackRock Greater Europe (LSE:BRGE) has clearly recognised the opportunities here, and has over 13% in med-tech companies (close to a quarter of its portfolio in the wider healthcare sector).
The trust has a highly flexible mandate, investing in large, mid and small capitalisation European companies, together with some investment in the developing markets of Europe.
As with Henderson EuroTrust, Novo Nordisk is one of the largest holdings within the portfolio, with close to 6% to the NAV in the company.
However, manager Stefan Gries prefers med-tech stocks over large-cap pharmaceutical companies. Another example is Lonza Group (SGX:O6Z), which sits in their top five largest holdings at 5% of NAV.
The company is a leading biotechnology company domiciled in Switzerland.
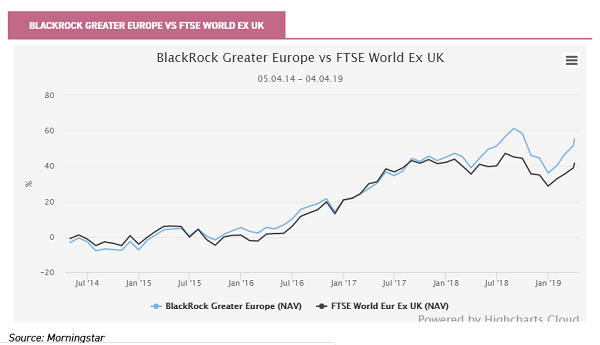
BlackRock Greater Europe has performed strongly over the past five years, comfortably outperforming the benchmark FTSE World Europe ex UK.
Technology
The technology sector is another key difference in exposure between the UK and European facing trusts.
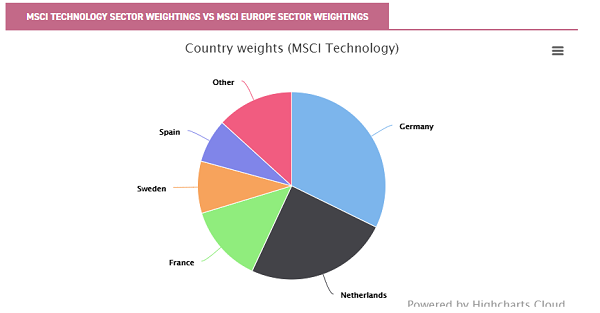
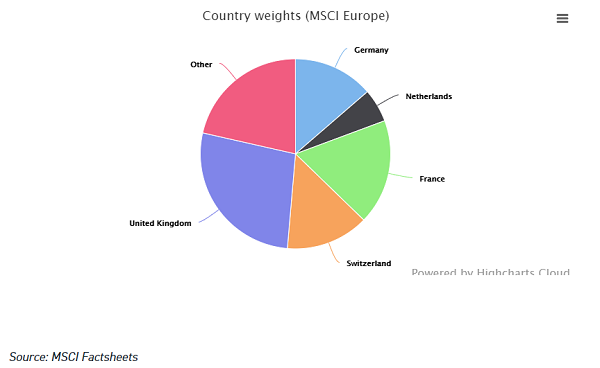
Below we compare the weightings of the constituent countries in the MSCI Europe index to the weightings of those countries to the MSCI Europe Information Technology index.
As we show, German companies make up 32.25% of the tech industry in Europe compared to just 14% of overall market capitalisation.
However, the UK does not even feature in the top five countries for tech, despite making up 27.2% of total market capitalisation, the most of any country.
In some ways, the lack of listed UK technology companies can be accounted for by US firms taking over the more valuable UK companies, especially over the past few years with the weakness in the pound.
Examples include Autonomy in 2011 and ARM in 2016, both fast growing UK technology companies taken over by foreign companies.
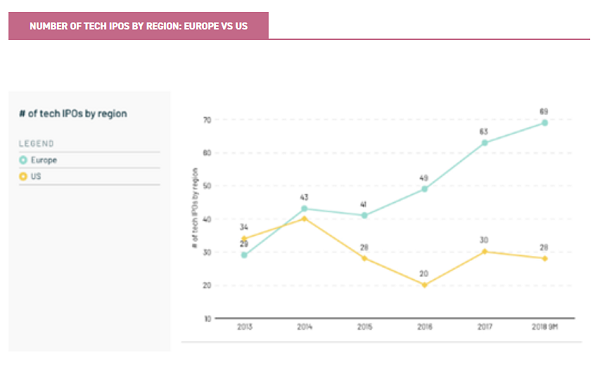
At the same time, there has been exponential growth in the number of technology companies IPOing in Europe.
In fact, over the past five years Europe has been home to more than double the number of technology IPOs relative to the US.
Of this, the European companies that have gone public in 2018 have on average seen their share price increase by more than 222%. In comparison, in the US the average new launch had average gains of close to 40%.
Source: The state of European tech 2018
2018 was also record breaking for Europe due to the size of the launches. Europe (ex UK), had three new launches with an enterprise value of more than $5 billion in 2018 (including , for example Spotify's (NYSE:SPOT) $25 billion listing) versus just one from the US and the UK. Furthermore, of the top 10 largest VC-backed IPOS in 2018 in Europe, only 2 came from the UK.
Much of the reason for the unrelenting growth of tech in Europe is due to the history of the countries. Germany for example, the largest sector weight, has a rich heritage in manufacturing and industrials.
The country is a global leader across multiple fields, including automotive (BMW (XETRA:BMW), Porsche (XETRA:PAH3) and Volkswagen (XETRA:VOW)), sportswear (adidas (XETRA:ADS)) and electrical and electronics companies (Siemens AG (XETRA:SIE)). This has meant that Germany has been able to take the lead in the next industrial evolution, coined 'Industrie 4.0'.
Industrie 4.0 embodies a new age of digital industrial technology, mainly the capacity to gather and analyze data across machines, enabling a more efficient processes to produce higher-quality goods.
A good illustration of this is the German software company SAP (XETRA:SAP), which sits in both of BlackRock Greater Europe and Fidelity European Values (LSE:FEV) portfolios. The company offers real time data on a company's industrial output – which is becoming increasingly important with the rise of automated factories.
Given the close relationship in Germany between technology and industry, their technology companies are well-positioned to benefit as we move beyond the consumer phase of the tech adoption curve towards industrial adoption. JPMorgan European Smaller Companies have long recognised this movement.
Francesco Conte has been at the helm of the portfolio for over 20 years, sees it as one of the most exciting developments across the world. He believes we are on the cusp of great change as automation and the exchange of data revolutionise industries.
One example of a company set to benefit within his portfolio is Tomra, a German company that specialises in sensing and automation.
In Germany, you recoup a euro when you take a bottle back for recycling – making it extremely uneconomical to simply throw your bottles away.
Tomra makes machines that sit outside supermarkets and accept these bottles, sorting them by colour and dispensing the reward.
The technology developed by the company has been extended to provide systems for farms and food processors which dramatically reduce waste; sorting fruit and vegetables, for example, by ripeness so that only food at the right stage is sent to market and therefore maximising the value from any crop.
They have also expanded into the mining industry, where Tomra's scanning technology has been used in the discovery / recovery of five out of the last ten "big" diamond discoveries.
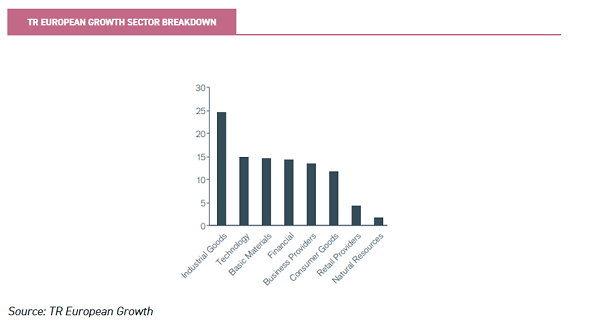
TR European Growth (LSE:TRG), a smaller companies trust led by Ollie Beckett, also has a large position in technology, although also looking at the opportunities outside of Industrie 4.0.
The manager is far more bullish on semiconductors and software companies, including the likes of Dialog Semiconductor (XETRA:DLG) and S.O.I.T.E.C.
The trust is one that has been hit particularly hard during equity market volatility in Q4 2018, with the manager's slightly more value-led approach contrary to the market's momentum.
With this said, for investors who believe Europe's troubles are over-stated, the current discount of close to 13% could be seen as a great opportunity.
Luxury goods
Along with the broader sectors, like technology and healthcare, there are also smaller subsectors the Europe offers investors differentiated exposure to.
Luxury goods in particular is an area that stands out for Europe.
In June 2018, Deloitte produced their annual list of the top 100 luxury goods companies.
France and Italy dominated the list, with Italy having 24 companies in the 100, and France's nine companies representing almost 25% of all sales in the sector.
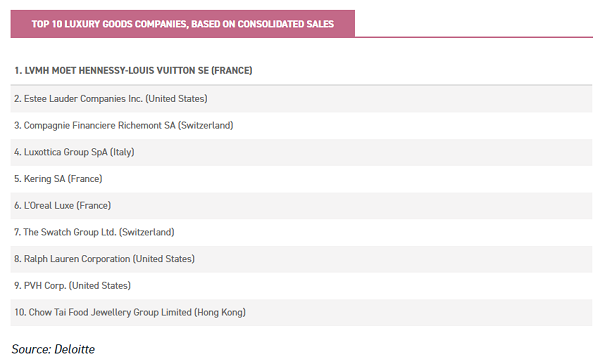
The ten companies that can be seen above generate around half of the total luxury good sales across the world, and they continue to grow at astonishing rates. In the Deloitte report, they note that LVMH had grown at a rate of 17.2% (over the year to end June 2018), and Kering (XETRA:PPX) nearly quadrupled its sales growth over the same period.
When looking at the ten fastest growing companies, based on the compound annual growth rate over a two-year period, 70% of the companies resided in Europe - but not one was in the UK.
In order for a UK manager to gain exposure to a luxury goods company, they have only three publicly traded options highlighted by Deloitte: Burberry (LSE:BRBY), Ted Baker (LSE:TED) (!?) and Mulberry (LSE:MUL). Although Burberry has recently been re-rated due to its change in brand strategy, both Ted Baker and Mulberry have been through torrid periods of performance, down 59% and 41% over the past year respectively.
In comparison, managers in Europe have an abundance of opportunities to invest in luxury goods companies, and unsurprisingly most managers across the AIC Europe take advantage of this. BlackRock Greater Europe for example, hold both Compagnie Financière Richemont and the aforementioned Kering. Henderson European Focus holds LVMH, whereas Henderson EuroTrust holds Hermes (EURONEXT:RMS).
Cyclical vs. Defensives
Alongside luxury goods, one will notice that managers in Europe are considerably less exposed to cyclical stocks and hold more defensive positions.
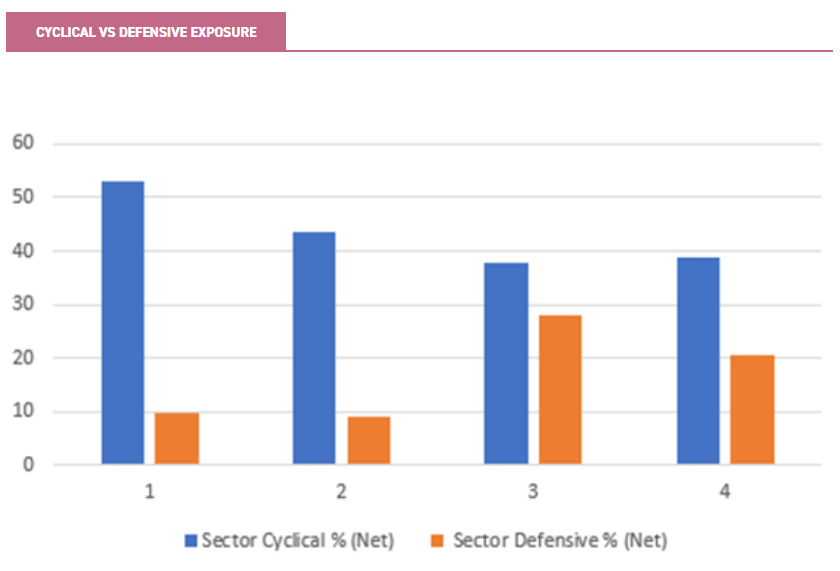
Source: Morningstar
Although it is true that European managers have recently tilted their portfolios towards more defensive stocks, chiefly due to the bumpy ride for European equities over 2018, the main reason for the differences in exposure is the lack of defensive options in the UK.
The MSCI UK All Cap All-share, for example, is dominated by banks (11%), energy (15%) and industrials (11%), all typically very cyclical industries.
The MSCI Europe (ex UK) in comparison, has considerably more options in healthcare (14%), consumer staples (14%), and financials (in addition to only banks).
Alongside this, the size of the companies that the managers are investing in mean that European investment trusts might be considered less sensitive and less cyclical.
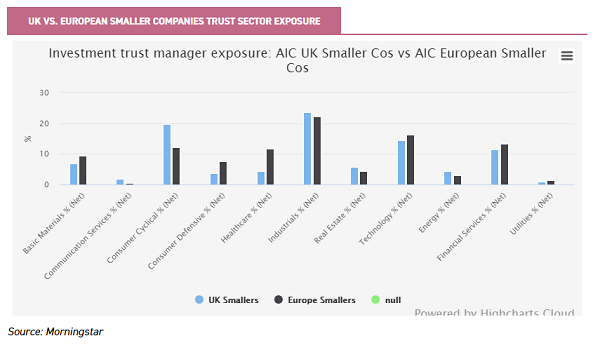
Trusts in the AIC Europe sector have considerably more large-cap holdings than UK-facing trusts, meaning that they are less likely to suffer the fluctuations of cycles.
The AIC UK All Companies sector managers have on average only 20% in large cap companies, as opposed to 73% from the European managers. Astonishingly, managers in the UK All companies space have on average over 40% in smaller companies vs only 8% in Europe.
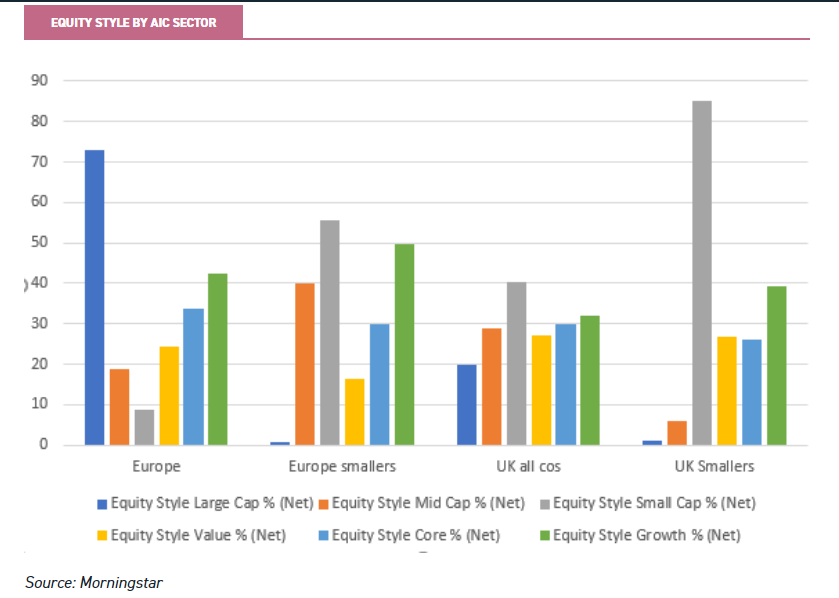
As can be seen, this is also reflected in the small-cap space, where the European managers have considerably more mid cap-stocks.
On average the managers have only 55% in the smaller companies, relative to 85% from the UK managers.
Despite this, European companies are considered to have 42% of the portfolios in growth companies, relative to the UK’s 32%, according to Morningstar data.
Conclusion
As we have previously mentioned, Europe has long been the hunting ground for the managers who generate the highest levels of alpha.
With this said, Europe remains to be the most out of favour region, clouded by uncertainty due to political and macroeconomic events.
This could not only mean that investors are light on exposure to Europe and the unique sectors and companies that are domiciled there, but also over exposed to some of the UK, and its possibly more cyclical sectors.
As we have shown, sectors like healthcare and technology are not easily accessible in the UK, and can be expensive to get access to in the US.
As such, with European investment trusts trading on historically wide discounts, and offering exposure to some of the unique gems that can only be found in Europe, now could be the perfect time to diversify portfolios into them.
Kepler Partners is a third-party supplier and not part of interactive investor. Neither Kepler Partners or interactive investor will be responsible for any losses that may be incurred as a result of a trading idea.
Full performance can be found on the company or index summary page on the interactive investor website. Simply click on the company's or index name highlighted in the article.
Important Information
Kepler Partners is not authorised to make recommendations to Retail Clients. This report is based on factual information only, and is solely for information purposes only and any views contained in it must not be construed as investment or tax advice or a recommendation to buy, sell or take any action in relation to any investment.
This report has been issued by Kepler Partners LLP solely for information purposes only and the views contained in it must not be construed as investment or tax advice or a recommendation to buy, sell or take any action in relation to any investment. If you are unclear about any of the information on this website or its suitability for you, please contact your financial or tax adviser, or an independent financial or tax adviser before making any investment or financial decisions.
The information provided on this website is not intended for distribution to, or use by, any person or entity in any jurisdiction or country where such distribution or use would be contrary to law or regulation or which would subject Kepler Partners LLP to any registration requirement within such jurisdiction or country. Persons who access this information are required to inform themselves and to comply with any such restrictions. In particular, this website is exclusively for non-US Persons.
The information in this website is not for distribution to and does not constitute an offer to sell or the solicitation of any offer to buy any securities in the United States of America to or for the benefit of US Persons.
This is a marketing document, should be considered non-independent research and is subject to the rules in COBS 12.3 relating to such research. It has not been prepared in accordance with legal requirements designed to promote the independence of investment research.
No representation or warranty, express or implied, is given by any person as to the accuracy or completeness of the information and no responsibility or liability is accepted for the accuracy or sufficiency of any of the information, for any errors, omissions or misstatements, negligent or otherwise. Any views and opinions, whilst given in good faith, are subject to change without notice.
This is not an official confirmation of terms and is not to be taken as advice to take any action in relation to any investment mentioned herein. Any prices or quotations contained herein are indicative only.
Kepler Partners LLP (including its partners, employees and representatives) or a connected person may have positions in or options on the securities detailed in this report, and may buy, sell or offer to purchase or sell such securities from time to time, but will at all times be subject to restrictions imposed by the firm's internal rules. A copy of the firm's conflict of interest policy is available on request.
Past performance is not necessarily a guide to the future. The value of investments can fall as well as rise and you may get back less than you invested when you decide to sell your investments. It is strongly recommended that Independent financial advice should be taken before entering into any financial transaction.
PLEASE SEE ALSO OUR TERMS AND CONDITIONS
Kepler Partners LLP is a limited liability partnership registered in England and Wales at 9/10 Savile Row, London W1S 3PF with registered number OC334771.
Kepler Partners LLP is authorised and regulated by the Financial Conduct Authority.
Kepler Partners is a third-party supplier and not part of interactive investor. Neither Kepler Partners or interactive investor will be responsible for any losses that may be incurred as a result of a trading idea.
These articles are provided for information purposes only. Occasionally, an opinion about whether to buy or sell a specific investment may be provided by third parties. The content is not intended to be a personal recommendation to buy or sell any financial instrument or product, or to adopt any investment strategy as it is not provided based on an assessment of your investing knowledge and experience, your financial situation or your investment objectives. The value of your investments, and the income derived from them, may go down as well as up. You may not get back all the money that you invest. The investments referred to in this article may not be suitable for all investors, and if in doubt, an investor should seek advice from a qualified investment adviser.
Full performance can be found on the company or index summary page on the interactive investor website. Simply click on the company's or index name highlighted in the article.
Important Information
Kepler Partners is not authorised to make recommendations to Retail Clients. This report is based on factual information only, and is solely for information purposes only and any views contained in it must not be construed as investment or tax advice or a recommendation to buy, sell or take any action in relation to any investment.
This report has been issued by Kepler Partners LLP solely for information purposes only and the views contained in it must not be construed as investment or tax advice or a recommendation to buy, sell or take any action in relation to any investment. If you are unclear about any of the information on this website or its suitability for you, please contact your financial or tax adviser, or an independent financial or tax adviser before making any investment or financial decisions.
The information provided on this website is not intended for distribution to, or use by, any person or entity in any jurisdiction or country where such distribution or use would be contrary to law or regulation or which would subject Kepler Partners LLP to any registration requirement within such jurisdiction or country. Persons who access this information are required to inform themselves and to comply with any such restrictions. In particular, this website is exclusively for non-US Persons. The information in this website is not for distribution to and does not constitute an offer to sell or the solicitation of any offer to buy any securities in the United States of America to or for the benefit of US Persons.
This is a marketing document, should be considered non-independent research and is subject to the rules in COBS 12.3 relating to such research. It has not been prepared in accordance with legal requirements designed to promote the independence of investment research.
No representation or warranty, express or implied, is given by any person as to the accuracy or completeness of the information and no responsibility or liability is accepted for the accuracy or sufficiency of any of the information, for any errors, omissions or misstatements, negligent or otherwise. Any views and opinions, whilst given in good faith, are subject to change without notice.
This is not an official confirmation of terms and is not to be taken as advice to take any action in relation to any investment mentioned herein. Any prices or quotations contained herein are indicative only.
Kepler Partners LLP (including its partners, employees and representatives) or a connected person may have positions in or options on the securities detailed in this report, and may buy, sell or offer to purchase or sell such securities from time to time, but will at all times be subject to restrictions imposed by the firm's internal rules. A copy of the firm's conflict of interest policy is available on request.
Past performance is not necessarily a guide to the future. The value of investments can fall as well as rise and you may get back less than you invested when you decide to sell your investments. It is strongly recommended that Independent financial advice should be taken before entering into any financial transaction.
PLEASE SEE ALSO OUR TERMS AND CONDITIONS
Kepler Partners LLP is a limited liability partnership registered in England and Wales at 9/10 Savile Row, London W1S 3PF with registered number OC334771.
Kepler Partners LLP is authorised and regulated by the Financial Conduct Authority.
These articles are provided for information purposes only. Occasionally, an opinion about whether to buy or sell a specific investment may be provided by third parties. The content is not intended to be a personal recommendation to buy or sell any financial instrument or product, or to adopt any investment strategy as it is not provided based on an assessment of your investing knowledge and experience, your financial situation or your investment objectives. The value of your investments, and the income derived from them, may go down as well as up. You may not get back all the money that you invest. The investments referred to in this article may not be suitable for all investors, and if in doubt, an investor should seek advice from a qualified investment adviser.
Full performance can be found on the company or index summary page on the interactive investor website. Simply click on the company's or index name highlighted in the article.