Playing the gap: How to predict Shell's next share price move
6th November 2018 09:35
by Alistair Strang from Trends and Targets
Shell has made progress this year due to a recovery in oil prices, while a high dividend yield entices investors. Chartist Alistair Strang and his bespoke software predict what's next for the Anglo-Dutch giant.

Shell (LSE:RDSB)
It can be truly unusual to discover a share we've never publicly commented against but Royal Dutch Shell appears to fit the category. Despite a grotty prognosis for Big oil by a studio hysteric on the Jeremy Vine BBC Radio 2 show, we'd guess 'something' is happening which has provoked a few emails.
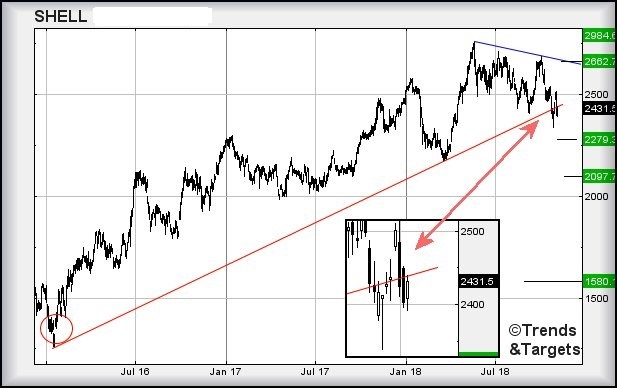
Our first item of consideration is the red line on the chart. At time of writing, the share price requires close above 2,436p to regain this trend. On the chart below, we've shown an inset which illustrates the dance being played out against this trend line.
It appears clear the market is indeed experiencing some collywobbles, with recent price movements now suggesting weakness below 2,338p should provoke travel to a fairly tame sounding 2,279p.
Only if 2,279p is broken do we start to think seriously above further reductions in the pipeline toward 2,097p next. And just to emphasise how nervous this would make us, because price movements would describe a "lower low", we'd be forced to mention the potential of an (hopefully) ultimate bottom at 1,580p.
• Shell: Are shares worth 30% more?
However, just because we've started this analysis by looking at the miserable side of life, Shell does have 'form' with some historical misbehaviour.
Circled at the bottom left of the chart is a class 'GaGa' where a GapDown/GapUp was used to kickstart the current upward cycle. This being the case, it still appears possible for movements above 2,535p to provide a challenge to the immediate downtrend with an initial target of 2,662p. Closure above will indicate a future 2,984p awaiting a visit!
Source: Trends and Targets Past performance is not a guide to future performance
Alistair Strang has led high-profile and "top secret" software projects since the late 1970s and won the original John Logie Baird Award for inventors and innovators. After the financial crash, he wanted to know "how it worked" with a view to mimicking existing trading formulas and predicting what was coming next. His results speak for themselves as he continually refines the methodology.
Alistair Strang is a freelance contributor and not a direct employee of Interactive Investor. All correspondence is with Alistair Strang, who for these purposes is deemed a third-party supplier. Buying, selling and investing in shares is not without risk. Market and company movement will affect your performance and you may get back less than you invest. Neither Alistair Strang or Interactive Investor will be responsible for any losses that may be incurred as a result of following a trading idea.
These articles are provided for information purposes only. Occasionally, an opinion about whether to buy or sell a specific investment may be provided by third parties. The content is not intended to be a personal recommendation to buy or sell any financial instrument or product, or to adopt any investment strategy as it is not provided based on an assessment of your investing knowledge and experience, your financial situation or your investment objectives. The value of your investments, and the income derived from them, may go down as well as up. You may not get back all the money that you invest. The investments referred to in this article may not be suitable for all investors, and if in doubt, an investor should seek advice from a qualified investment adviser.
Full performance can be found on the company or index summary page on the interactive investor website. Simply click on the company's or index name highlighted in the article.