Should you follow Neil Woodford and sell Lloyds Bank shares?
8th October 2018 08:47
by Alistair Strang from Trends and Targets
Fund manager Neil Woodford recently removed the retail bank from his Equity Income fund. Chartist Alistair Strang runs the numbers to see if he was right.
Lloyds Bank (LSE:LLOY)
Whether it's PopMaster on Radio 2 (One Year Out!), Eggheads, or even The Chase, we constantly witness people talking themselves out of the right answer. We did it ourselves with the FTSE 100 on Friday. From our perspective, it was drop dead obvious the index was heading to 7,338 but then, made the mistake of questioning it.
The FTSE indeed dropped 76 points to our target, even plonking around for 2 1/2 hours at the level to prove we'd been working on the correct trend. And then it fell further. Our next major point of interest remains around the 7,100 level.
Over-analysis can prove the biggest "One Year Out!" enemy as often the first reaction will be correct. This brings us neatly around to Lloyds Banking Group.
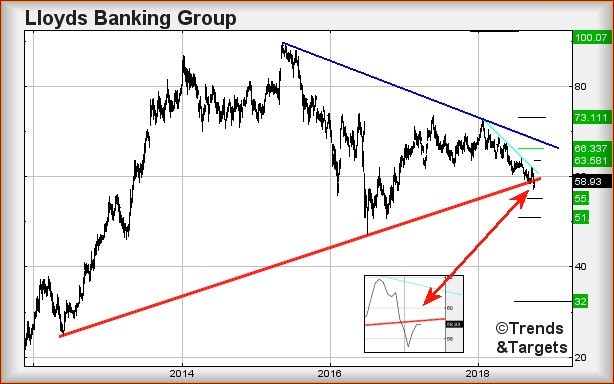
Since April, we've been reporting 51p as a drop target, something the share has conspicuously avoided hitting. Recently, it has been tempting to look at contrary indicators on the basis our first "Big Picture" analysis was wrong. But when we collect the other members of the sector together, absolutely everything suggests they face further relaxation.
Do we stick with our 51p or not?
We're inclined to remain with this as "bottom" on Lloyds. It closed the session on Friday at 58.93p. The uptrend since 2012 is currently at 59.13p.
While the numbers are almost identical, of greater interest are the closing prices shown on the chart insert.
Since 1 October, the share price has resolutely avoided closing above the trend, and this is something regarded as bad. It appears we're not the only folk paying attention to this trend, with the price is not permitted to regain it.
So yes, we're sticking to 51p though there's a fair chance of a fake, short-lived bounce at the 55p level first.
The real problem on the Lloyds chart (which isn't showing) is lurking below 51p. What happens if 51p is broken?
We can give 32p as "best hope", but if we were on a quiz show, our first answer is 5p. Unfortunately, that's how dangerous things are for the future. Hopefully we can join the "One Year Out!" club and get this prediction wrong.
Finally, it needs only to better 61.7p to escape the immediate downtrend and prove you wasted your time reading the foregoing. But to get real, the share needs to better dark blue at 68.5p to utterly trash the drop potentials.
A ridiculous drop potential to 5p for Lloyds. Are UK banks a safe trade?
Source: Trends and Targets Past performance is not a guide to future performance
Alistair Strang has led high-profile and "top secret" software projects since the late 1970s and won the original John Logie Baird Award for inventors and innovators. After the financial crash, he wanted to know "how it worked" with a view to mimicking existing trading formulas and predicting what was coming next. His results speak for themselves as he continually refines the methodology.
Alistair Strang is a freelance contributor and not a direct employee of Interactive Investor. All correspondence is with Alistair Strang, who for these purposes is deemed a third-party supplier. Buying, selling and investing in shares is not without risk. Market and company movement will affect your performance and you may get back less than you invest. Neither Alistair Strang or Interactive Investor will be responsible for any losses that may be incurred as a result of following a trading idea.
These articles are provided for information purposes only. Occasionally, an opinion about whether to buy or sell a specific investment may be provided by third parties. The content is not intended to be a personal recommendation to buy or sell any financial instrument or product, or to adopt any investment strategy as it is not provided based on an assessment of your investing knowledge and experience, your financial situation or your investment objectives. The value of your investments, and the income derived from them, may go down as well as up. You may not get back all the money that you invest. The investments referred to in this article may not be suitable for all investors, and if in doubt, an investor should seek advice from a qualified investment adviser.
Full performance can be found on the company or index summary page on the interactive investor website. Simply click on the company's or index name highlighted in the article.