A stock in one chart: Free cash at Cranswick
15th September 2016 09:00
by Phil Oakley from ii contributor
Former City analyst Phil Oakley believes the fortunes of many companies can be summed up in a single financial chart. This week it's .
Cranswick makes its money selling premium, high-quality meat products such as pork, sausages, bacon, chicken and high-end sandwiches. This type of business tends to be very competitive, which makes it hard to make good profits.
By focusing on quality, Cranswick has been able to carve out a profitable niche for itself. So much so that it has one of the most impressive dividend track records on the UK stockmarket.
The company has grown its dividend for 26 years in a row, something that not many companies have been able to do. The chart below gives you a good idea why it has been able to do this.
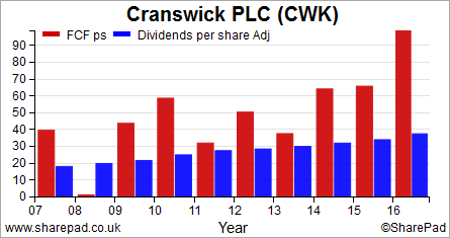
Cranswick is very good at producing lots of free cash flow, which leaves it with lots of money left over to pay dividends to shareholders.
For most of the last decade its free cash flow per share (the first/red bar) has been a lot more than the dividend it has paid to shareholders (the second/blue bar). Last year it produced free cash flow per share of 98p and paid 37.5p to shareholders, which was 10% more than the year before.
This big buffer of free cash flow means that Cranswick looks to be well placed to keep on increasing dividends - which goes a long way to explaining why its shares are so popular with investors.
The ii view
Cranswick is a stockmarket favourite. Profits hardly ever fall. Full-year results didn't disappoint, and neither did first quarter numbers in July. Sales rose 11% in the three months to June, or 5% if you strip out the April purchase of Crown Chicken, which sells poultry to Iceland. Selling its sandwich business for £15 million cash is good business, too, and, although a forward PE ratio of 19 is not cheap, it's the price you pay for consistent earnings and dividend growth.
"Read more from Phil Oakley here. Financial charts are a feature of SharePad, the web-based service from ShareScope. Voted UK's Best Investment Software 2015. For a limited period, you can get a three month subscription to SharePad for just £25."
This article is for information and discussion purposes only and does not form a recommendation to invest or otherwise. The value of an investment may fall. The investments referred to in this article may not be suitable for all investors, and if in doubt, an investor should seek advice from a qualified investment adviser.