What just happened with Eurasia Mining?
It's been a spectacular week for shares in this open cast miner. Our chartist revisits the numbers.
31st October 2019 09:50
by Alistair Strang from Trends and Targets
It's been a spectacular week for shares in this open cast miner. Our chartist revisits the numbers.
Eurasia Mining (LSE:EUA)
Eurasia Mining (LSE:EUA) rather neatly illustrated why timeframes are difficult. No-one realistically expected a 223% rise through all our targets in just three days but Eurasia managed it.
Today, assisting a friend with a pre-demolition survey gave a sharp reminder why care is needed when things go volatile.
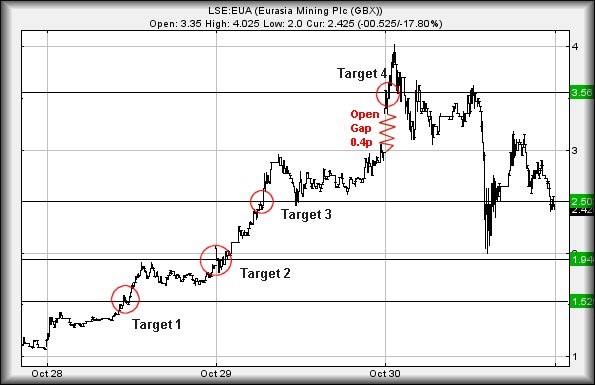
To give a perspective against this, we're showing two charts. The upper chart shows minute by minute movements since the market opened on Monday morning, following our report on Sunday evening.
It's always interesting and useful to see how a price reacts when a target level is achieved.
Often, we will say something like, "if exceeded, our secondary calculates at ..." but sometimes we remember to write; "if exceeded on the initial surge, secondary calculates at...".
Showing Eurasia in detail mode tends to highlight the logic behind this. When the price hit Target 1, it exceeded it. When the price hit Target 2, it exceeded it. When the price hit Target 3, it exceeded it.
And when the price hit Target 4, yes, it did exceed target but as the zigzag shows, the share was manipulated upward at the open.
So, even though the target level we'd mooted on Sunday evening was actually dramatically exceeded by 0.5p, the price had been gapped up by 0.4p to ensure this happened.
The ensuing reversal thereafter to 2p wasn't exactly a surprise. As the chart shows, the price attempted further breaks above 3.5p but eventually it failed and the inevitable occurred.
Source: Trends and Targets Past performance is not a guide to future performance
So what now? Is the price about to disappear into a hole in the Ural Mountains?
Certainly, we'll be quite concerned if it trades (as opposed to forced down in the opening second) below 2p.
Such a movement risks a quite nasty reversal, with 1.7p calculating as possible and the secondary, if broken, along at 1.10p. We'd certainly hope for a bounce around the 1.10p mark but thanks to that gap, the price risks 0.9p before a rebound.
However, we've a sneaking suspicion the share will probably mess around a while, ideally with 2p as the bottom of a trading range.
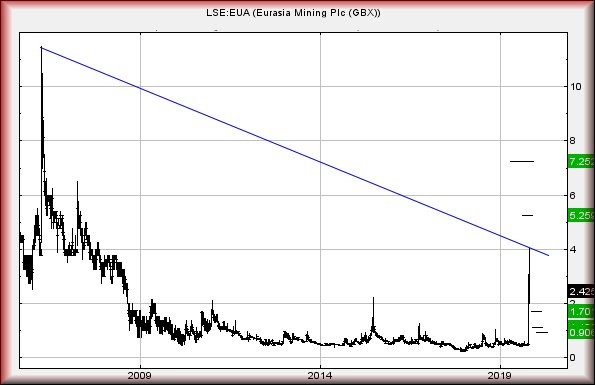
We're not ignoring the salient detail of our 3.56p ambition being exceeded, even when we factor in the 0.4p gap. As a result, anything now above 4.03p should prove capable of a lift to 5.25p with the secondary, if exceeded on the initial surge, calculating at 7.25p.
Visually, it appears the 10p level is the longer term thing to watch. Only if the company finds an excuse to trade above such a level shall we anticipate further fireworks, rather than a horror story.
Source: Trends and Targets Past performance is not a guide to future performance
Alistair Strang has led high-profile and "top secret" software projects since the late 1970s and won the original John Logie Baird Award for inventors and innovators. After the financial crash, he wanted to know "how it worked" with a view to mimicking existing trading formulas and predicting what was coming next. His results speak for themselves as he continually refines the methodology.
Alistair Strang is a freelance contributor and not a direct employee of Interactive Investor. All correspondence is with Alistair Strang, who for these purposes is deemed a third-party supplier. Buying, selling and investing in shares is not without risk. Market and company movement will affect your performance and you may get back less than you invest. Neither Alistair Strang, or interactive investor will be responsible for any losses that may be incurred as a result of following a trading idea.
Alistair Strang has led high-profile and "top secret" software projects since the late 1970s and won the original John Logie Baird Award for inventors and innovators. After the financial crash, he wanted to know "how it worked" with a view to mimicking existing trading formulas and predicting what was coming next. His results speak for themselves as he continually refines the methodology.
Alistair Strang is a freelance contributor and not a direct employee of Interactive Investor. All correspondence is with Alistair Strang, who for these purposes is deemed a third-party supplier. Buying, selling and investing in shares is not without risk. Market and company movement will affect your performance and you may get back less than you invest. Neither Alistair Strang or Interactive Investor will be responsible for any losses that may be incurred as a result of following a trading idea.
These articles are provided for information purposes only. Occasionally, an opinion about whether to buy or sell a specific investment may be provided by third parties. The content is not intended to be a personal recommendation to buy or sell any financial instrument or product, or to adopt any investment strategy as it is not provided based on an assessment of your investing knowledge and experience, your financial situation or your investment objectives. The value of your investments, and the income derived from them, may go down as well as up. You may not get back all the money that you invest. The investments referred to in this article may not be suitable for all investors, and if in doubt, an investor should seek advice from a qualified investment adviser.
Full performance can be found on the company or index summary page on the interactive investor website. Simply click on the company's or index name highlighted in the article.