What latest trend breakout means for BP shares
The oil major's shares have fully recovered from the April crash and are reaching important milestones. Independent analyst Alistair Strang discusses the implications for future price moves.
8th October 2025 07:51
by Alistair Strang from Trends and Targets
Since the start of July, any assumption that BP (LSE:BP.)’s share price has been tracking the price of crude oil would be quite erroneous. Brent crude has been dripping downhill, while BP has been slogging uphill, a genuine break for BP share price norms, perhaps even a strong indicator for happier days ahead.
Invest with ii:Open a Stocks & Shares ISA | Top ISA Funds | Transfer your ISA to ii
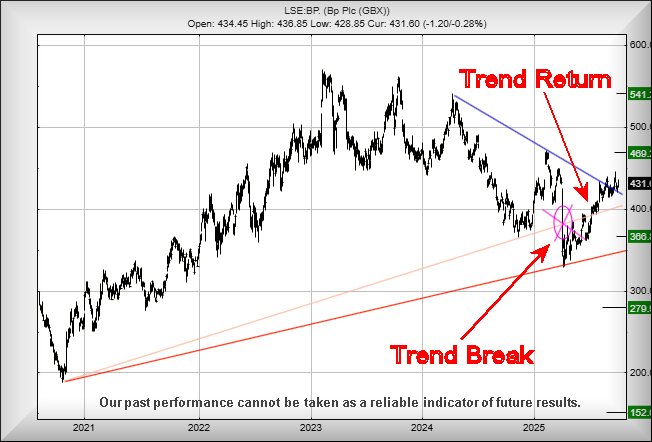
From our perspective, things kicked off just before the end of June this year, when their share price managed to close slightly above the level of a previous major trend break circled on the chart below.
We always regard this sort of signal as a pretty big deal, the next major firework being fully ignited when a share price regains this previous trend. This happened at the start of July and now we’re fairly interested in what’s coming next, especially as BP has also now broken through the immediate Blue downtrend since April of last year…
Currently, above just 437p risks becoming interesting, theoretically triggering gains to an initial 469p with our secondary target, if bettered, at a reasonable looking 541p and almost certain hesitation.
Should things decide to go BP-shaped, the price needs to dwindle below Blue, presently 419p, to risk triggering reversals down to an initial 365p with our secondary, if broken, at an eventual bottom of a frightening 279p.
For now, it appears BP's share price intends further gains.
Source: Trends and Targets. Past performance is not a guide to future performance.
Alistair Strang has led high-profile and "top secret" software projects since the late 1970s and won the original John Logie Baird Award for inventors and innovators. After the financial crash, he wanted to know "how it worked" with a view to mimicking existing trading formulas and predicting what was coming next. His results speak for themselves as he continually refines the methodology.
Alistair Strang is a freelance contributor and not a direct employee of Interactive Investor. All correspondence is with Alistair Strang, who for these purposes is deemed a third-party supplier. Buying, selling and investing in shares is not without risk. Market and company movement will affect your performance and you may get back less than you invest. Neither Alistair Strang or Interactive Investor will be responsible for any losses that may be incurred as a result of following a trading idea.
These articles are provided for information purposes only. Occasionally, an opinion about whether to buy or sell a specific investment may be provided by third parties. The content is not intended to be a personal recommendation to buy or sell any financial instrument or product, or to adopt any investment strategy as it is not provided based on an assessment of your investing knowledge and experience, your financial situation or your investment objectives. The value of your investments, and the income derived from them, may go down as well as up. You may not get back all the money that you invest. The investments referred to in this article may not be suitable for all investors, and if in doubt, an investor should seek advice from a qualified investment adviser.
Full performance can be found on the company or index summary page on the interactive investor website. Simply click on the company's or index name highlighted in the article.