What trend lines say about Lloyds Bank shares
High street banks have had an incredible year, but could this be just the beginning? Independent analyst Alistair Strang consults his charts for clues.
10th November 2025 09:40
by Alistair Strang from Trends and Targets
With the retail banks moving above their immediate layer of low cloud, we’ve been working hard at viewing the clouds from both sides now, in an attempt to come up with a reasonable set of predictions for the banking sector's future.
This has thrown up a few things which should perhaps have been obvious to us already but, quite bizarrely, when we take cognisance of events when the markets were manipulated due to Covid-19, there is a pretty firm conclusion to be made that with Lloyds Banking Group (LSE:LLOY), the market decided to employ the downtrend since 1998, 20 two years earlier.
- Invest with ii:Open a Stocks & Shares ISA | Top ISA Funds | Transfer your ISA to ii
On the big picture chart below, we’ve zoomed in on 2020 to show market movements in respect of the long-term downtrend, and there’s little argument the market was – for some insane reason – paying attention to this trend line!
To be plain, this means we are now supposed to believe a cycle to a long term 201p has commenced, but we prefer to throw some further criteria into the mix. However, we can cough politely and point out the market needs to fall below 28p to cancel the prospects of a future 201p making an appearance.
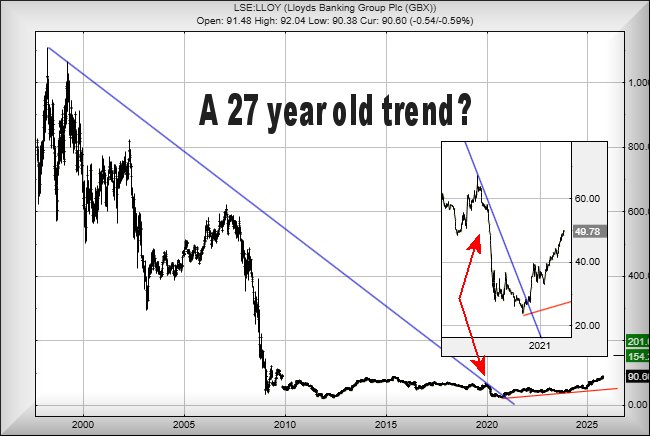
Source: Trends and Targets. Past performance is not a guide to future performance. Important: Trends and Targets charts only incorporate official share count consolidations, ignoring rights issues where investors have a choice as to whether to participate.
Then again, there’s the inset on the chart below, another Blue downtrend but one which dates back to 2009, before the financial crisis grew really frothy. If relying on this trend, the current implication is for movement above 92.25p triggering a nearer-term rise to an initial 112p with our secondary, if bettered, at 122p.
The close proximity of these target levels implies some hesitation can be anticipated in this area, but from a Big Picture argument, closure above 122p shall now be viewed as triggering the share price to leave the cloud cover behind and soar to the 201p level eventually.
The share price must retreat below 60p to spoil this overflow of optimism.
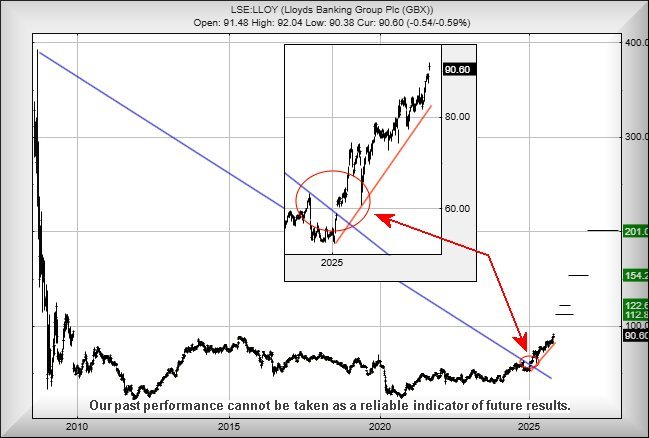
Source: Trends and Targets. Past performance is not a guide to future performance. Important: Trends and Targets charts only incorporate official share count consolidations, ignoring rights issues where investors have a choice as to whether to participate.
Alistair Strang has led high-profile and "top secret" software projects since the late 1970s and won the original John Logie Baird Award for inventors and innovators. After the financial crash, he wanted to know "how it worked" with a view to mimicking existing trading formulas and predicting what was coming next. His results speak for themselves as he continually refines the methodology.
Alistair Strang is a freelance contributor and not a direct employee of Interactive Investor. All correspondence is with Alistair Strang, who for these purposes is deemed a third-party supplier. Buying, selling and investing in shares is not without risk. Market and company movement will affect your performance and you may get back less than you invest. Neither Alistair Strang or Interactive Investor will be responsible for any losses that may be incurred as a result of following a trading idea.
These articles are provided for information purposes only. Occasionally, an opinion about whether to buy or sell a specific investment may be provided by third parties. The content is not intended to be a personal recommendation to buy or sell any financial instrument or product, or to adopt any investment strategy as it is not provided based on an assessment of your investing knowledge and experience, your financial situation or your investment objectives. The value of your investments, and the income derived from them, may go down as well as up. You may not get back all the money that you invest. The investments referred to in this article may not be suitable for all investors, and if in doubt, an investor should seek advice from a qualified investment adviser.
Full performance can be found on the company or index summary page on the interactive investor website. Simply click on the company's or index name highlighted in the article.