This is when Sirius Minerals shares should rebound
Our technical analyst has spotted a price level where traders might pile back into Sirius shares.
30th May 2019 08:52
by Alistair Strang from Trends and Targets
Our technical analyst has spotted a price level where traders might pile back into Sirius shares.

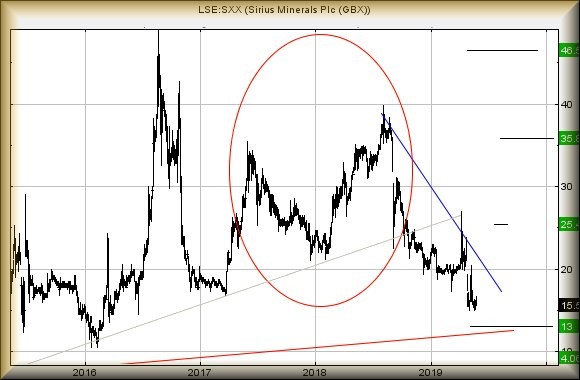
Sirius Minerals (LSE:SXX)
Our last in-depth look at Sirius Minerals (LSE:SXX) was back in February at 20p and it has been getting seriously close to our 13p target.
Interestingly, since their open offer deal, a few pundits are suggesting the share price is now undervalued, even proposing some interesting rise potentials. So, is it at bottom?
To be honest, we're not sure. The price is certainly hovering at the 15p level, giving an indication a "floor" has been found.
With our distrust of the way in which the market treats investors, we'd be uncomfortable suggesting it's at bottom, if only due to the price floundering around in "lower low" territory.
There can be little doubt that trades now below 14.95p should provoke reversal to 13p and visually a bounce.
Consider this. If the price were somehow to close below 13p, actual bottom should prove to be at around 4p!
The folk who believe in chart patterns should not be confused with those who follow horoscopes or technical indicators.
Quite often, a complex sounding chart pattern is simply describing a logical mental process. The current one potentially effecting Sirius is circled in red on the chart.
The first peak is the "Hey, I don't think it will get higher, I'm taking profit" sentiment. The second peak echoes the initial one. And the third peak is fairly simple; "It's had a good run, don't trust it now, I'm out of here".
At this point, another force takes over; "Ooops, it has broken the immediate uptrend again. Think I'll just wait and see."
And before you know it, you've got a classic head and shoulders formation, one which points at reversal to 4p eventually.
Essentially, it's entirely based on how a trader will view price movements, along with the emotional cycle. More often than not, it works out, even if you have to squint a bit to recognise the chart pattern.
Our own thinking is of reversal coming to 13p anytime soon, along with a bounce at such a point. The red uptrend dates back to 2010 and should prove perfectly capable for traders to pile in, with the belief such a long-term uptrend must provoke a rebound.
At present, any rebound exceeding 22p should bring a visit to an initial 25.5p. If exceeded, secondary calculates at 35p in the future. In fact, we can even compute a best case scenario at 46p, a point where we'd again stir the tea leaves.
For now, it feels like 13p shall prove worth watching for.
Source: Trends and Targets Past performance is not a guide to future performance
Alistair Strang has led high-profile and "top secret" software projects since the late 1970s and won the original John Logie Baird Award for inventors and innovators. After the financial crash, he wanted to know "how it worked" with a view to mimicking existing trading formulas and predicting what was coming next. His results speak for themselves as he continually refines the methodology.
Alistair Strang is a freelance contributor and not a direct employee of Interactive Investor. All correspondence is with Alistair Strang, who for these purposes is deemed a third-party supplier. Buying, selling and investing in shares is not without risk. Market and company movement will affect your performance and you may get back less than you invest. Neither Alistair Strang or Interactive Investor will be responsible for any losses that may be incurred as a result of following a trading idea.
These articles are provided for information purposes only. Occasionally, an opinion about whether to buy or sell a specific investment may be provided by third parties. The content is not intended to be a personal recommendation to buy or sell any financial instrument or product, or to adopt any investment strategy as it is not provided based on an assessment of your investing knowledge and experience, your financial situation or your investment objectives. The value of your investments, and the income derived from them, may go down as well as up. You may not get back all the money that you invest. The investments referred to in this article may not be suitable for all investors, and if in doubt, an investor should seek advice from a qualified investment adviser.
Full performance can be found on the company or index summary page on the interactive investor website. Simply click on the company's or index name highlighted in the article.