Where next for the FTSE 100 and Dow Jones?
Both indices have shown similar behaviours lately. Our chartist looks for potential upsides.
6th November 2020 09:32
by Alistair Strang from Trends and Targets
Both indices have shown similar behaviours lately. Our chartist looks for potential upsides.

The Dow & FTSE for Friday (FTSE:UKX)
As the entertainment from North America continues, we're about ready to wind up our US features.
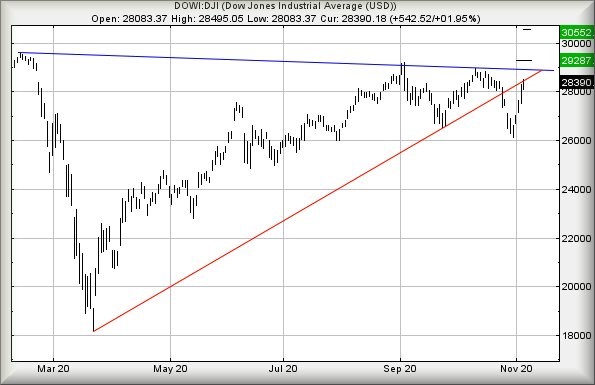
The Dow Jones completed Thursday looking a bit underwhelmed by all the scare stories.
Instead, Wall Street looks poised for movement to new all-time highs and this, perhaps, should be the real shock given the much-publicised second wave of the pandemic.
As someone without an effective immune system this is obviously a worry, but realistically, maintaining low levels of paranoia has been relatively easy, thanks to living in the countryside of Scotland where people scarcity is the norm.
For Wall Street, movement next above 28,500 points looks capable of driving market growth to an initial 29,287 points.
This comes very close to challenging the previous all-time market high in February this year. Despite the visuals suggesting a potential glass ceiling, we're not convinced.
Moves above 29,287 should prove capable of attaining 30,552 points eventually, yet another all-time high and a remarkable feat for such a tragic year as 2020.
A small fly in the ointment is presented by the red line on the chart.
The index needed to close the session on 5 November above 28,427 points.
Despite a day high above this level, the market closed at 28,390 points and slightly below the line.
Source: Trends and Targets Past performance is not a guide to future performance
FTSE for Friday (FTSE:UKX)
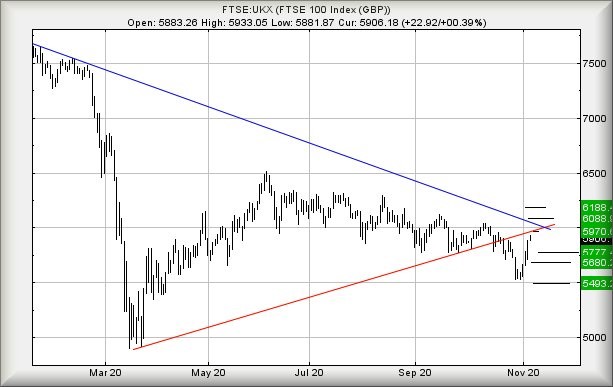
Quite remarkably, the FTSE 100 has exhibited similar behaviour to the Dow Jones in respecting its red uptrend since the Covid-19 drop in March.
There are even very early signs a true market rally is nearly upon us, the logic behind which totally defeats me. The immediate situation is fairly impressive.
Movement next above 5,934 points should prove capable of lifting the market to an initial 5,970 points.
If exceeded, our ‘longer-term’ secondary (aka maybe later that day) calculates at 6,088 points.
The secondary is pretty important, placing the UK index in a zone where a further 100 point lift to 6,188 becomes expected.
But critically, the market absolutely must close a session above 6,088 to permit untrammelled optimism for the future.
While visually this argument may not make sense, our software is showing 6,088 as a ‘red flag’ level which must be beaten.
If things intend go horribly wrong, the FTSE needs to reverse below 5,825 to give the first sign of trouble ahead, allowing reversal to commence to an initial 5,777 points.
If broken, our secondary calculates down at 5,680 points.
Source: Trends and Targets Past performance is not a guide to future performance
Alistair Strang has led high-profile and "top secret" software projects since the late 1970s and won the original John Logie Baird Award for inventors and innovators. After the financial crash, he wanted to know "how it worked" with a view to mimicking existing trading formulas and predicting what was coming next. His results speak for themselves as he continually refines the methodology.
Alistair Strang is a freelance contributor and not a direct employee of Interactive Investor. All correspondence is with Alistair Strang, who for these purposes is deemed a third-party supplier. Buying, selling and investing in shares is not without risk. Market and company movement will affect your performance and you may get back less than you invest. Neither Alistair Strang or Interactive Investor will be responsible for any losses that may be incurred as a result of following a trading idea.
These articles are provided for information purposes only. Occasionally, an opinion about whether to buy or sell a specific investment may be provided by third parties. The content is not intended to be a personal recommendation to buy or sell any financial instrument or product, or to adopt any investment strategy as it is not provided based on an assessment of your investing knowledge and experience, your financial situation or your investment objectives. The value of your investments, and the income derived from them, may go down as well as up. You may not get back all the money that you invest. The investments referred to in this article may not be suitable for all investors, and if in doubt, an investor should seek advice from a qualified investment adviser.
Full performance can be found on the company or index summary page on the interactive investor website. Simply click on the company's or index name highlighted in the article.