Will this chart breakout trigger a rally at Tesco?
The supermarket's stock has done very little since 2019, but signs of a turnaround are there.
21st January 2021 08:34
by Alistair Strang from Trends and Targets
The supermarket's stock has done very little since 2019, but signs of a turnaround are there.
Tesco
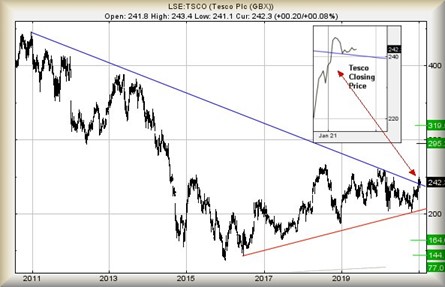
It was a bit of a shock to realise we last covered Tesco (LSE:TSCO)in 2019, with the share price doing very little since. Finally, it's showing potential for change, with a flurry of emails suggesting other folk have noticed something potentially important. It's certainly surprising against the backdrop of the UK's doom and gloom.
Then again, essential retail generally does pretty well when the price of goods is no longer the driving imperative.
The share has a pretty vivid downtrend since 2012, the price effectively flatlining since 2017.
But now the price has finally exceeded this potentially important downtrend. Obviously, this gives no certainty of imminent increase. It just places the share in a region where positive news can enjoy positive price movements, unhindered by a trend line many investors shall feel important.
We've shown the somewhat hesitant break through the trend on the chart inset, price movements since the start of the year indicating the wider market is also perfectly aware of this downtrend.
- ii view: Tesco's £5 billion special dividend
- Online sales boost Tesco, though Covid-19 takes its toll
- Covid-19 wipes out eight years of UK dividend growth
- Why reading charts can help you become a better investor
Our inclination is now to play safe rather than trumpet the potential of amazing rises ahead. Instead, we've established 260p as a viable trigger level with movement above this point calculating with the potential of an initial 295p with secondary, if exceeded, working out at a longer-term 319p.
In keeping with playing safe when looking at recovery potentials, we've opted similar methodology for examining trigger levels for reversals. Tesco’s share price needs to trade below 189p to give sufficient excuse for panic. This sort of thing risks proving quite traumatic, giving an initial 164p with secondary, if broken, at a bottom of 144p.
Oddly, this isn't as bad as Tesco could get. For light relief, we calculated where our ‘ultimate bottom’ resides, the number below which we cannot calculate. It works out at 77p, almost the price of two Cadbury’s Creme Eggs from Tesco. But Sainsbury’s is selling them for just 35p. We suspect, if we ever witnessed Tesco’s share price at such a level, we'd feel safer buying the chocolate treat instead!
Source: Trends and Targets. Past performance is not a guide to future performance
Alistair Strang has led high-profile and "top secret" software projects since the late 1970s and won the original John Logie Baird Award for inventors and innovators. After the financial crash, he wanted to know "how it worked" with a view to mimicking existing trading formulas and predicting what was coming next. His results speak for themselves as he continually refines the methodology.
Alistair Strang is a freelance contributor and not a direct employee of interactive investor. All correspondence is with Alistair Strang, who for these purposes is deemed a third-party supplier. Buying, selling and investing in shares is not without risk. Market and company movement will affect your performance and you may get back less than you invest. Neither Alistair Strang or interactive investor will be responsible for any losses that may be incurred as a result of following a trading idea.
These articles are provided for information purposes only. Occasionally, an opinion about whether to buy or sell a specific investment may be provided by third parties. The content is not intended to be a personal recommendation to buy or sell any financial instrument or product, or to adopt any investment strategy as it is not provided based on an assessment of your investing knowledge and experience, your financial situation or your investment objectives. The value of your investments, and the income derived from them, may go down as well as up. You may not get back all the money that you invest. The investments referred to in this article may not be suitable for all investors, and if in doubt, an investor should seek advice from a qualified investment adviser.
Full performance can be found on the company or index summary page on the interactive investor website. Simply click on the company's or index name highlighted in the article.