Is Barclays boring and what about Tesco shares?
13th September 2021 07:44
by Alistair Strang from Trends and Targets
Shares in these two FTSE 100 stalwarts have had a good few months, but what might happen next?
We have to concede, writing about each of the big three retail banks, once every three weeks, has become a tad repetitive. So, to give folk a slight break, this week’s coverage of Barclays (LSE:BARC) can consist of a single sentence.
If it goes below 174p, we expect an initial visit to 167p with secondary, if broken, at a bottom of 155p. Now for Tesco (LSE:TSCO)!
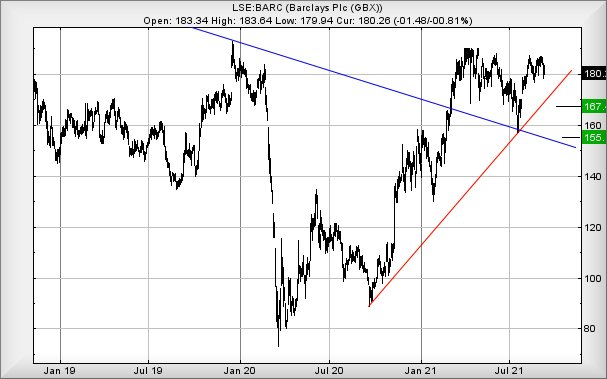
Source: Trends and Targets. Past performance is not a guide to future performance.
Tesco are rather more interesting than Barclays, their share price actually making some real movements.
When we reviewed the share back in April, we speculated on a future which involved 242p initially, with secondary at 259p. More importantly, with closure above 242p, we could dream of a future which encompassed a visit to 295p eventually.
Amazingly, we’d shown a chart with a target of 259p, and the high eventually attained last week was 259.6p, then the price reversed slightly.
Visually, there are plenty of reasons to embrace hope for the future, despite a plethora of media headlines warning of food shortages due to Brexit and lack of lorry drivers. But as the UK government has announced, we can expect supermarket shelves being full for Xmas, there’s clearly nothing to worry about.
On the basis Tesco manages to discover how to stock their shops, the pandemic also opting not to revisit the country in winter fatality mode, it’d be churlish not to admit there’s a feeling of ‘back to normal’ nervously prowling the country.
For Tesco, should the share next manage to trade above 260p, a further growth cycle to an initial 268p with secondary, if exceeded, now working out at 291p calculates as possible. The share price has been nervously flirting with the pre-pandemic highs, but there are plenty of reasons to hope for future price positivity.
Even if it all intends to go wrong, the immediate situation threatens weakness below 248p leading down to an initial 240p. If broken, our secondary works out at 225p, signalling an unhealthy interest in the blue downtrend which dates back to 2010. We would anticipate a rebound in the unlikely event such a target level appears.
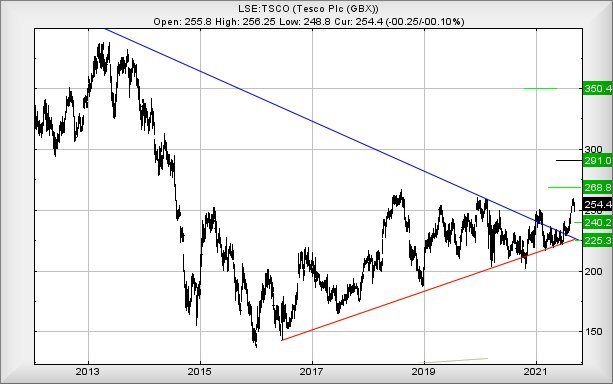
Source: Trends and Targets. Past performance is not a guide to future performance.
Alistair Strang has led high-profile and "top secret" software projects since the late 1970s and won the original John Logie Baird Award for inventors and innovators. After the financial crash, he wanted to know "how it worked" with a view to mimicking existing trading formulas and predicting what was coming next. His results speak for themselves as he continually refines the methodology.
Alistair Strang is a freelance contributor and not a direct employee of Interactive Investor. All correspondence is with Alistair Strang, who for these purposes is deemed a third-party supplier. Buying, selling and investing in shares is not without risk. Market and company movement will affect your performance and you may get back less than you invest. Neither Alistair Strang or Interactive Investor will be responsible for any losses that may be incurred as a result of following a trading idea.
These articles are provided for information purposes only. Occasionally, an opinion about whether to buy or sell a specific investment may be provided by third parties. The content is not intended to be a personal recommendation to buy or sell any financial instrument or product, or to adopt any investment strategy as it is not provided based on an assessment of your investing knowledge and experience, your financial situation or your investment objectives. The value of your investments, and the income derived from them, may go down as well as up. You may not get back all the money that you invest. The investments referred to in this article may not be suitable for all investors, and if in doubt, an investor should seek advice from a qualified investment adviser.
Full performance can be found on the company or index summary page on the interactive investor website. Simply click on the company's or index name highlighted in the article.