Can Barclays rise from the mud to the stars?
4th April 2022 07:35
by Alistair Strang from Trends and Targets
The UK bank appeared to be a bright light in the sector, says independent analyst Alistair Strang. Where is it heading next?
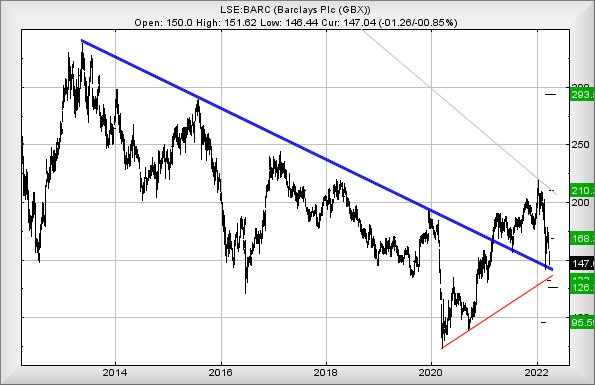
The blue downtrend on the Barclays (LSE:BARC) chart (since 2013!) is proving fascinating. For seven years, the market appeared committed to stopping the share price bettering blue, no matter what. But since March 2021, and the share price finally exceeding blue, the market appears committed to stopping the share price moving below blue. Instead, we've a painful series of reversals that tease blue, but fail to close below. We fear this respect for the trend line may be close to coming to an end.
Currently trading around 147p, the share price need only break below 142p to trigger reversal to an initial 132p. If broken, our secondary calculates at 126p, along with a vague hope for a bounce. We're forced to be a little cagey with our hopes, due to the harsh reality of the share price entering a zone where a longer-term cycle to an eventual bottom at 95p becomes very possible.
What's truly surprising about this shambles is pretty straightforward. For a while, Barclays appeared to be shining brightly among the UK banking sector, but somehow it now appears to have face-planted in the mud. It's not an encouraging sight and we are inclined to suggest keeping an eye on this as surely, if 95p makes an appearance, a proper bounce will become possible.
In the hope that everything going on with Barclays is just an optical delusion (it's not), allegedly the share price need only exceed 152p to give hope for surprise recovery, calculating with an initial potential of recovery to a tame-looking 168p. With closure above such a level, things become rather more interesting as we now work out the potential of 210p making a future appearance.
For now, we suspect the price is as safe as the current UK prime minister's grip on the keys of power. Watching Have I Got News For You on Friday, the opening 10-plus minutes comprised constant jokes at the PM's gaffes, with not one of the jokes being repeated to pad things out.
Source: Trends and Targets. Past performance is not a guide to future performance.
Alistair Strang has led high-profile and "top secret" software projects since the late 1970s and won the original John Logie Baird Award for inventors and innovators. After the financial crash, he wanted to know "how it worked" with a view to mimicking existing trading formulas and predicting what was coming next. His results speak for themselves as he continually refines the methodology.
Alistair Strang is a freelance contributor and not a direct employee of Interactive Investor. All correspondence is with Alistair Strang, who for these purposes is deemed a third-party supplier. Buying, selling and investing in shares is not without risk. Market and company movement will affect your performance and you may get back less than you invest. Neither Alistair Strang or Interactive Investor will be responsible for any losses that may be incurred as a result of following a trading idea.
These articles are provided for information purposes only. Occasionally, an opinion about whether to buy or sell a specific investment may be provided by third parties. The content is not intended to be a personal recommendation to buy or sell any financial instrument or product, or to adopt any investment strategy as it is not provided based on an assessment of your investing knowledge and experience, your financial situation or your investment objectives. The value of your investments, and the income derived from them, may go down as well as up. You may not get back all the money that you invest. The investments referred to in this article may not be suitable for all investors, and if in doubt, an investor should seek advice from a qualified investment adviser.
Full performance can be found on the company or index summary page on the interactive investor website. Simply click on the company's or index name highlighted in the article.