Can BT shares bounce back from seven-month low?
20th October 2021 07:46
by Alistair Strang from Trends and Targets
After breaking above 200p for the first time since 2019, shares have lost a third of their value since a June peak. Here's what independent analyst Alistair Strang's software reveals about price potential.
When we reviewed BT Group (LSE:BT.A) in April, we gave criteria for movement toward the 200p level. This was a pretty concise success but we forgot our promise to recalculate should such a level make an appearance.
The period since has been dire, the share price opting to mimic their customer service, coming completely unwound. There’s now an issue making itself known, probably not helped by the latest news of their policy of overcharging customers which has resulted in a class action.
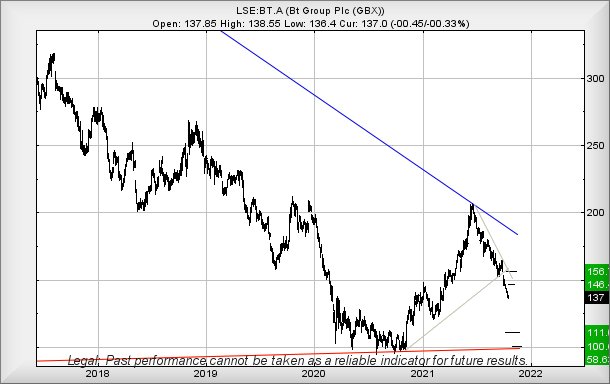
From our perspective, it’s all about the 134p share price level. Given the share is presently trading around 137p, very little work is required to hit our next reversal trigger, one with some interesting (but with potentially useful) consequences.
Below 134p now threatens reversal to an initial 111p. Our secondary, if the initial target breaks, is a fascinating 100p. The secondary rates special interest, thanks to the presence of the Red line on the chart.
This level dates back to the market crash of 2009, a trend which the market has proven extremely shy of breaking below. Even last year, with all the pandemic trauma, despite a flurry of intraday movements nodding below Red, the stock market was extremely careful to ensure the share price closed on the line, never below.
We’ve shown this extraordinary period below as it gives considerable hope should our secondary target of 100p make an appearance anytime soon.
Essentially, reaching 100p comes with a reasonable chance a bounce can be expected. If opting to try a Long position, a stop-loss could be placed just below last year's low of 94p, though we must point out we’re nowhere near a position where we can speculate how high any rebound may extend.
At present, the share price needs better than 139p to give the potential of movement to an initial 146p, with secondary, if bettered, a longer term 156p. Unfortunately, the current visuals suggest the market expects BT shares to fall a bit further, and this is why we point out the 100p level may be worth keeping an eye on.
Source: Trends and Targets. Past performance is not a guide to future performance
Alistair Strang has led high-profile and "top secret" software projects since the late 1970s and won the original John Logie Baird Award for inventors and innovators. After the financial crash, he wanted to know "how it worked" with a view to mimicking existing trading formulas and predicting what was coming next. His results speak for themselves as he continually refines the methodology.
Alistair Strang is a freelance contributor and not a direct employee of Interactive Investor. All correspondence is with Alistair Strang, who for these purposes is deemed a third-party supplier. Buying, selling and investing in shares is not without risk. Market and company movement will affect your performance and you may get back less than you invest. Neither Alistair Strang or Interactive Investor will be responsible for any losses that may be incurred as a result of following a trading idea.
These articles are provided for information purposes only. Occasionally, an opinion about whether to buy or sell a specific investment may be provided by third parties. The content is not intended to be a personal recommendation to buy or sell any financial instrument or product, or to adopt any investment strategy as it is not provided based on an assessment of your investing knowledge and experience, your financial situation or your investment objectives. The value of your investments, and the income derived from them, may go down as well as up. You may not get back all the money that you invest. The investments referred to in this article may not be suitable for all investors, and if in doubt, an investor should seek advice from a qualified investment adviser.
Full performance can be found on the company or index summary page on the interactive investor website. Simply click on the company's or index name highlighted in the article.