Chart analysis: Boohoo shares in trouble
12th October 2021 06:59
by Alistair Strang from Trends and Targets
This well-known name is struggling right now. Independent analyst Alistair Strang studies the charts for clues as to future direction.

Unsurprisingly, Boohoo Group (LSE:BOO) features in our email requests. Boohoo, despite online retailers achieving success, currently enjoys a share price just 50% below its high this year and does not present a pretty picture for the future.
We’d previously expressed dismay at the online retailer experiencing remarkable success in bucking an upward trend which other online companies have enjoyed. Their Lockdown period recovery started off well, but now has fallen apart.
We find ourselves in the ridiculous position of being forced to mention the lowest we can calculate is 65p. We cannot work out a number below such a dreadful level.
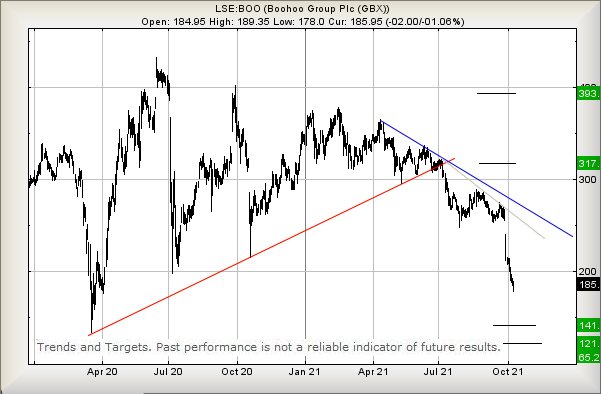
Source: Trends and Targets. Past performance is not a guide to future performance
The immediate situation is troubling. When we previously reviewed Boohoo back in July, we proposed a scenario with reversal to 198p, hopeful this would present a “bottom” for the troubled share price. A few days ago, the price cheerfully ignored our calculations and simply kept nudging downward.
Presently at 185p, we’re not optimistic for the future as below just 178p suggests ongoing weakness coming to an initial 141p.
Normally we’d hope for a rebound at such a level, especially as it virtually matches the pandemic low of March 2020. However, should 141p break, bottom works out at 121p with recovery threatening to be a confused process.
For Boohoo to even regain the immediate downtrend, the share price requires exceed 265p to give hope. In doing so, we can calculate a cycle commencing to 393p eventually.
Alistair Strang has led high-profile and "top secret" software projects since the late 1970s and won the original John Logie Baird Award for inventors and innovators. After the financial crash, he wanted to know "how it worked" with a view to mimicking existing trading formulas and predicting what was coming next. His results speak for themselves as he continually refines the methodology.
Alistair Strang is a freelance contributor and not a direct employee of Interactive Investor. All correspondence is with Alistair Strang, who for these purposes is deemed a third-party supplier. Buying, selling and investing in shares is not without risk. Market and company movement will affect your performance and you may get back less than you invest. Neither Alistair Strang or Interactive Investor will be responsible for any losses that may be incurred as a result of following a trading idea.
These articles are provided for information purposes only. Occasionally, an opinion about whether to buy or sell a specific investment may be provided by third parties. The content is not intended to be a personal recommendation to buy or sell any financial instrument or product, or to adopt any investment strategy as it is not provided based on an assessment of your investing knowledge and experience, your financial situation or your investment objectives. The value of your investments, and the income derived from them, may go down as well as up. You may not get back all the money that you invest. The investments referred to in this article may not be suitable for all investors, and if in doubt, an investor should seek advice from a qualified investment adviser.
Full performance can be found on the company or index summary page on the interactive investor website. Simply click on the company's or index name highlighted in the article.