Chart update: FTSE 100, FTSE 250 and AIM
With little end in sight to recent stock market volatility, independent analyst Alistair Strang's software has given a new set of possibilities.
1st April 2026 07:45
by Alistair Strang from Trends and Targets
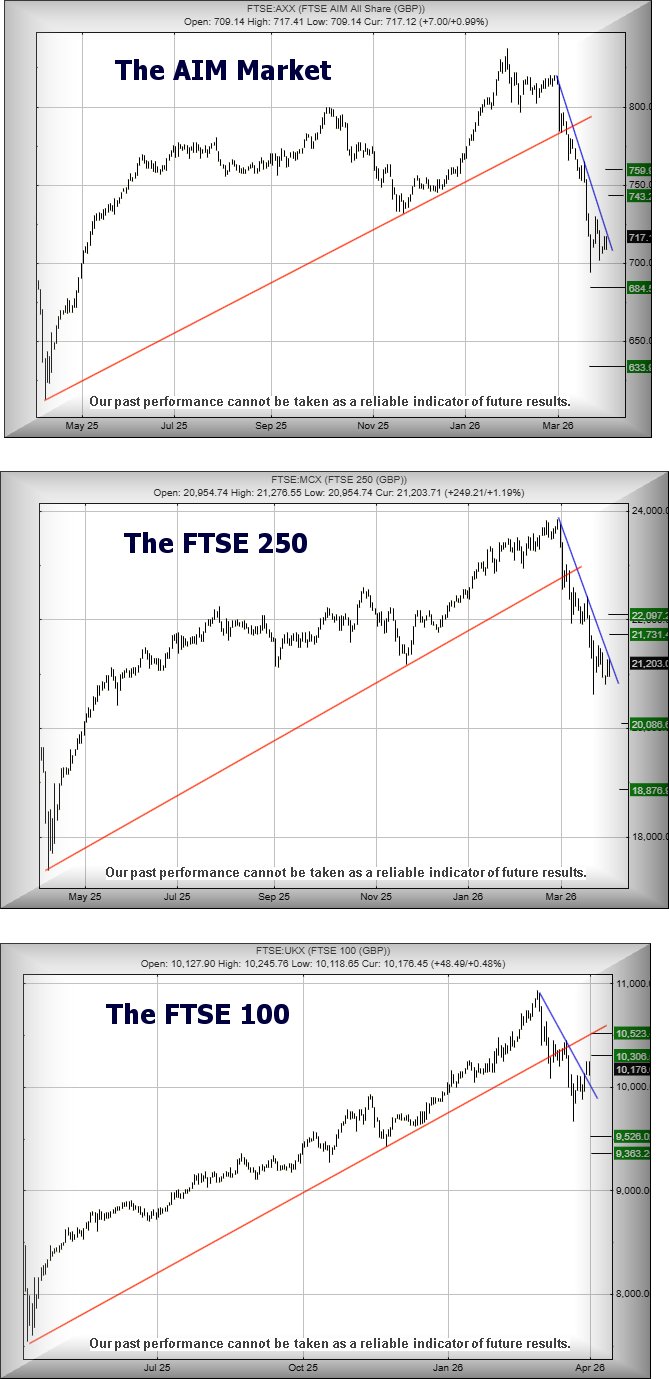
Running comparisons seemed a good idea when trying to figure out what the markets are up to. The FTSE 100 can be misleading, throwing a fit when anything bad happens internationally. Obviously, this is due to the multinational makeup of FTSE components, whereas AIM and the FTSE 250 mainly reflect UK trauma. Overall, should this be the case, the FTSE 250 and the AIM are not reacting well to what’s happening ‘locally’, the market placing each index in quite a difficult situation, where further reversals appear probable.
- Invest with ii:Open a Stocks & Shares ISA | Top ISA Funds | Transfer your ISA to ii
Currently, AIM risks some pain as movement below 693 points looks capable of triggering reversal down to an initial 684 with our secondary, if broken, working out at a probable bottom at 633 points. This would indicate the potential of AIM matching the Covid lows in 2020, a very possible scenario and one which paints an unhappy picture for many AIM components.
The FTSE 250, as shown below, is in a very similar situation to AIM, there being a strong suggestion any weakness below 20,810 points risks triggering a fun Easter Egg roll, one which will doubtless target an initial 20,086 points with our secondary, if broken, working out at a potential bottom of 18,878 points.
In an identical manner to AIM, this risks challenging a trend which commenced with the 2020 lows for the FTSE 250. In other words, more pain for the stock market until the UK manages to figure itself out and give the markets some hope.
Conversely, there’s the FTSE 100 itself, a market which has (currently) escaped the more severe downward pressures facing the other two, instead offering a surprising amount of optimism. Above 10,246 points should next trigger recovery to 10,306 points with our secondary, if bettered, an extremely significant 10,523 points.
As the chart shows, achieving such a secondary would exceed the previous level of trend break at 10,400 points. Traditionally, this is one of the market movements where setting off a party popper is usually justified as it would bode extremely well for the future. But, unfortunately, there’s the puzzle of AIM and the FTSE 250, neither looking poised for anything positive.
If AIM is to generate some smiles, it needs above 730 points to ideally trigger recovery to an initial 743 with our secondary, if beaten, calculating at 759 points. While visually this secondary is almost certain to provide a level where the market shall pause, market closure above the 759 level should prove capable of generating a future 826 points, returning the index to the land of happiness and good weather. We fear, despite AIM’s fascination with the immediate Blue downtrend, it is fated to make a visit to 633 points eventually.
As for the FTSE 250, it must climb above 21,520 to hopefully trigger an initial 21,731 with our secondary, if bettered, at 22,097 points and in an identical fashion to AIM above, some almost certain hesitation. Theoretically, closure above 22,097 should open the door for a return to the land of milk and honey, giving a long-term suggestion that 23,792 points could be “a thing” sometime in the future.
It’s going to be interesting as the suggestion is of international events helping the FTSE 100, while local influences in the UK continue their damage to the other two ‘junior’ markets.
Source: Trends and Targets. Past performance is not a guide to future performance.
Alistair Strang has led high-profile and "top secret" software projects since the late 1970s and won the original John Logie Baird Award for inventors and innovators. After the financial crash, he wanted to know "how it worked" with a view to mimicking existing trading formulas and predicting what was coming next. His results speak for themselves as he continually refines the methodology.
Alistair Strang is a freelance contributor and not a direct employee of Interactive Investor. All correspondence is with Alistair Strang, who for these purposes is deemed a third-party supplier. Buying, selling and investing in shares is not without risk. Market and company movement will affect your performance and you may get back less than you invest. Neither Alistair Strang or Interactive Investor will be responsible for any losses that may be incurred as a result of following a trading idea.
These articles are provided for information purposes only. Occasionally, an opinion about whether to buy or sell a specific investment may be provided by third parties. The content is not intended to be a personal recommendation to buy or sell any financial instrument or product, or to adopt any investment strategy as it is not provided based on an assessment of your investing knowledge and experience, your financial situation or your investment objectives. The value of your investments, and the income derived from them, may go down as well as up. You may not get back all the money that you invest. The investments referred to in this article may not be suitable for all investors, and if in doubt, an investor should seek advice from a qualified investment adviser.
Full performance can be found on the company or index summary page on the interactive investor website. Simply click on the company's or index name highlighted in the article.