Commodities outlook: Oil sector analysis
It's been a huge week for oil prices, but what now? Our financial markets analyst analyses copper too.
19th September 2019 13:22
by Rajan Dhall from interactive investor
It's been a huge week for oil prices, but what now? Our financial markets analyst analyses copper too.

This week has been an incredibly volatile week in the energy markets after the Saudi Aramco oil refinery, responsible for 5% of the world's total oil supply, was bombed by terrorist drones.
Amazingly, the speed at which the Saudi's got the facility back to capacity has been nothing short of a miracle. It is said that 80% of the output has already been restored.
Moving forward, there are some key questions to be answered. The US says it has evidence that Iran was behind the attacks. The Saudi officials agree, but there has not been any outcome in regards any retaliation.
Some speculate war, but the most likely outcome will be an increase in economic sanctions. If this is the case, more of Iran's oil supply will come off the market and we could see another oil price rise. For now, we wait and see what the American government decides.
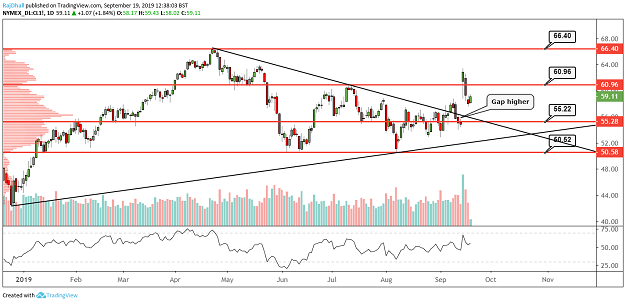
On the technical side, the price of US crude spiked at the open on Monday. The high stands at $63.83 per barrel and, once the Saudi's brought a large amount of production back, the price fell close to a median value range. The volume indicator at the bottom of the chart shows large amount of volume.
On the downside, there is a support level at $55.22 per barrel that matches up with a trendline support zone. This is typical of a technical structure after the triangle breakout at the beginning of the week. The daily chart could show some more short-term weakness in that case before a move higher.
Source: TradingView Past performance is not a guide to future performance
Copper has taken another turn to the downside again after Chinese industrial production data disappointed markets. After printing above $2.70 per pound, the price has moved lower by around 10 cents. Next week we have PMI data from the EU with Germany in focus, while China releases industrial profit statistics. The German read has recently had a massive effect on base metals prices, so keep an eye out.
On the equities front KAZ Minerals (LSE:KAZ), Rio Tinto (LSE:RIO) and Glencore (LSE:GLEN) have all risen off their worst levels as the copper price moved higher and consolidated.
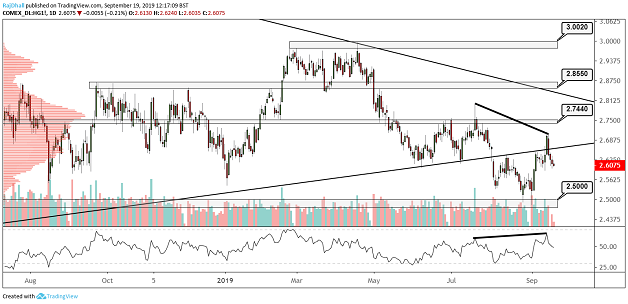
Looking at the daily chart below, it seems the price has now retested the trendline it broke on the downside. The price tried to come back into the previous consolidation low but has now failed. The support zone at $2.50 per pound is key support, but we are some way off that point and the data next week could play a massive role in the future path of price.
Source: TradingView Past performance is not a guide to future performance
Lastly, there is a bearish technical signal on the chart. The top of the two previous peaks are sloping down, but on the RSI indicator the waves are sloping higher. This is called a failure swing or hidden divergence.
In the short term, we may see some more bearish price action and, heading into next week's data, $2.60 per pound will surely be a pivot point.
Rajan Dhall is a freelance contributor and not a direct employee of interactive investor.
These articles are provided for information purposes only. Occasionally, an opinion about whether to buy or sell a specific investment may be provided by third parties. The content is not intended to be a personal recommendation to buy or sell any financial instrument or product, or to adopt any investment strategy as it is not provided based on an assessment of your investing knowledge and experience, your financial situation or your investment objectives. The value of your investments, and the income derived from them, may go down as well as up. You may not get back all the money that you invest. The investments referred to in this article may not be suitable for all investors, and if in doubt, an investor should seek advice from a qualified investment adviser.
Full performance can be found on the company or index summary page on the interactive investor website. Simply click on the company's or index name highlighted in the article.