Dividend dilemma: the trade-off between yield and growth
11th February 2022 14:00
by John Dowie from Kepler Trust Intelligence
Kepler examines whether it is best to maximise income today, or wait for potentially higher dividends in the future.

This content is provided by Kepler Trust Intelligence, an investment trust focused website for private and professional investors. Kepler Trust Intelligence is a third-party supplier and not part of interactive investor. It is provided for information only and does not constitute a personal recommendation.
Material produced by Kepler Trust Intelligence should be considered a marketing communication, and is not independent research.
Income investors have always faced the trade-off between maximising current income and growing dividends in the future. High dividend-paying stocks are often ‘cash cows’, that is well-established businesses that generate lots of free cash to distribute but are mature and have limited growth prospects. Dividend growth stocks on the other hand tend to pay lower yields as they use part of their cashflows to reinvest to generate future growth. At a trust level, different managers and boards will approach this trade-off differently, and in this note we will explore quantitatively the magnitude of this trade-off.
A toy model
To give an intuitive feel of the trade-off between current yield and dividend growth, below is a stylised toy model with three investments A, B and C with starting yields of 3% p.a., 4% p.a. and 5% p.a. and with constant dividend growth rates of 5% p.a., 2% p.a. and 0% p.a.
Of course, it is highly unrealistic to have no variability in the dividend growth rate, but this model is for illustrative purposes only. The below chart plots the annual income from each investment based on an initial investment of £100.
So, for year one the income from investments A, B and C are £3.00 (3% of £100), £4.00 (4% of £100) and £5 (5% of £100) respectively. Each year the dividends grow in line with the dividend growth rates of 5%, 2%, and 0%. Hence, for year 2 investment A pays a dividend of £3.00 x 1.05 = £3.15, for B it is £4.00 x 1.02 = £4.08 and C is unchanged as it has a zero growth rate.
TOY MODEL OF DIVIDEND GROWTH USING ILLUSTRATIVE PARAMETERS
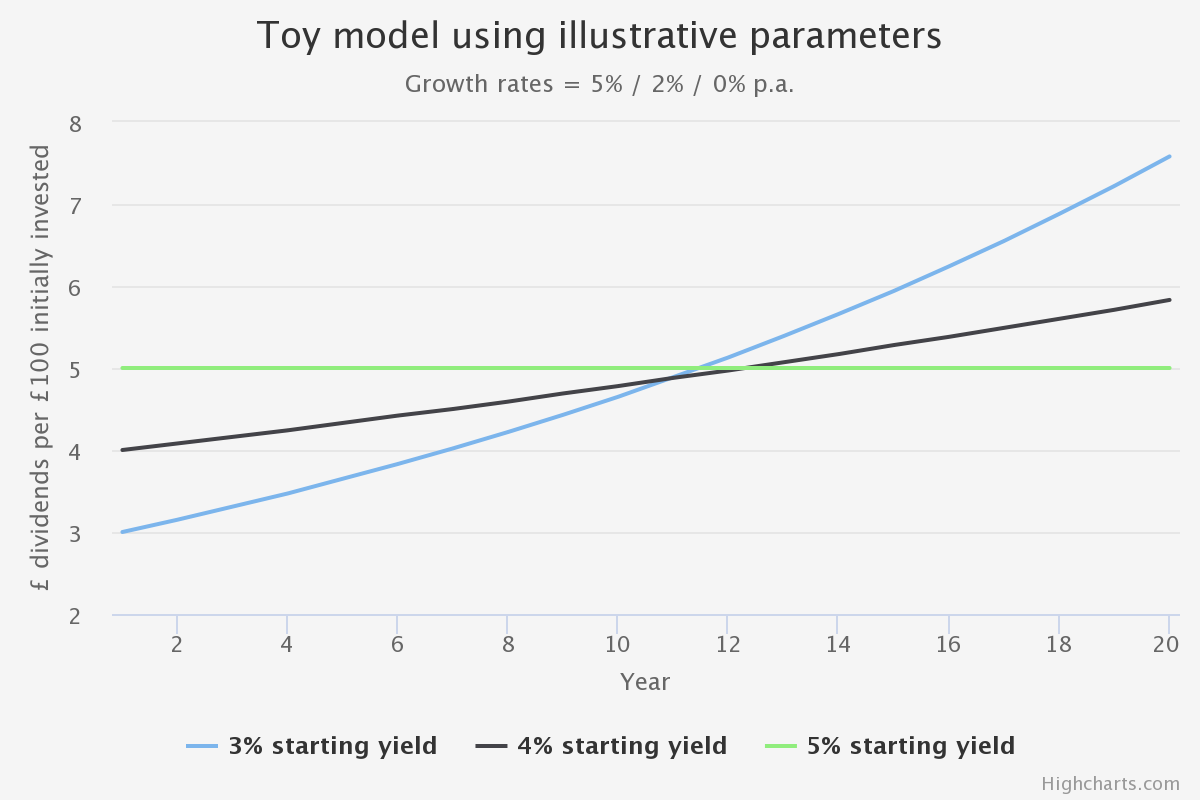
Source: Kepler Partners
As can be seen, in the early years the higher yielding investments pay out more, as to be expected. However, as time progresses and the dividend growth compounds the investments with faster growing incomes, A and B overtake C in annual payments around year 12, and as A grows fastest it rapidly becomes the highest paying investment. This illustrates the trade-off: in the first few years an investor in A would receive a limited income, but after a decade or so would begin to receive higher annual payments.
What the data says
Now we have an intuitive feel for the arithmetic of the trade-off between yield and dividend growth, the question is how severe is the trade-off in the real world? To answer this question, we collated all the dividend payments made per share each financial year and the monthly yield figure of each trust in the UK Equity Income and Global Equity Income AIC sectors (the yield being the dividends paid over a 12-month period divided by the share price). We excluded trusts that had an investment policy of paying out a fixed amount of NAV per period, as consuming capital to pay an income is a separate issue from growing dividends based on increasing the natural income of underlying investments. We then regressed the starting yield of each trust against its subsequent three-year dividend growth for financial years 2014 – 2018 (inclusive). The results are plotted in the below chart.
DIVIDEND GROWTH VERSUS STARTING YIELD OF UK AND GLOBAL EQUITY INCOME SECTORS

Source: Morningstar, AIC, Kepler Partners
On the chart, each dot is a single trust. The x axis is the initial yield at the beginning of each three-year period, and the y axis plots the subsequent dividend growth rate for the three years (the growth rate is annualised). As can be seen, there is a consistent negative relationship between growth rate and yield, i.e. generally, the higher the starting yield the lower the subsequent dividend growth rate. This indicates there is a genuine trade-off between current yield and growth. As per the below table the R-squared (a statistical measure of how much one variable accounts for the changes in another variable) is c. 0.5, suggesting a strong relationship. There are of course other factors influencing the dividend growth rate other than the starting yield, such as the performance of the underlying portfolio, changes in the level and cost of gearing, shifts in strategy, use of reserves etc.
An interesting point to note is that for the period 2018 – 2021, which fully includes the pandemic period when many companies rapidly cut or eliminated their dividends, the relationship between starting yield and dividend growth for trusts largely broke down. This likely reflects both the very different portfolio outcomes between trusts (some largely avoided the big dividend cuts from the likes of banks, others took major hits to their earnings) and different levels of reserves available to use by boards. Although uncertain, we would expect the relationship between yield and dividend growth to re-establish itself once market conditions normalise and the pandemic periods roll out of the periods under analysis.
In the below table are the regression coefficients calculated for each of the five three-year periods in the sample.
REGRESSION COEFFICIENTS
| TIME PERIOD | COEFFICIENT (%) | INTERCEPT (%) | R-SQUARED |
| FY 2014-2017 | -3.3 | 16.3 | 0.50 |
| FY 2015 - 2018 | -2.4 | 13.5 | 0.52 |
| FY 2016 - 2019 | -2.6 | 15.1 | 0.54 |
| FY 2017- 2020 | -2.3 | 12.8 | 0.32 |
| FY 2018 - 2021 | -1.4 | 8.9 | 0.09 |
Source: Kepler Partners
Without wishing to get too involved in the mathematics, this essentially allows an estimate of the dividend growth rate of a trust given a particular starting yield. How this is done is laid out in the appendix. The coefficients used were an average of the five sample periods, excluding 2018 – 2021, which due to the pandemic we consider anomalous. It should be noted that this is a model, which deals in averages and uncertain predictions, and any given trust can have a yield and dividend growth rate entirely different from that predicted by the model. With that being said, the model predicts that, based on history, for trusts with the following yields, the three-year dividend growth rates will be as follows:
MODELLED DIVIDEND GROWTH RATES VERSUS INITIAL YIELDS
| STARTING DIVIDEND YIELD | SUBSEQUENT THREE-YEAR DIVIDEND GROWTH RATE |
| 2.0% | 9.1% |
| 3.0% | 6.5% |
| 4.0% | 3.8% |
| 5.0% | 1.2% |
Source: Kepler Partners
To give an intuitive feel for what this might mean to an investor, we plugged these numbers into our toy model (again, it is highly unrealistic to assume a constant dividend growth rate):
TOY MODEL OF DIVIDEND GROWTH USING ESTIMATED PARAMETERS
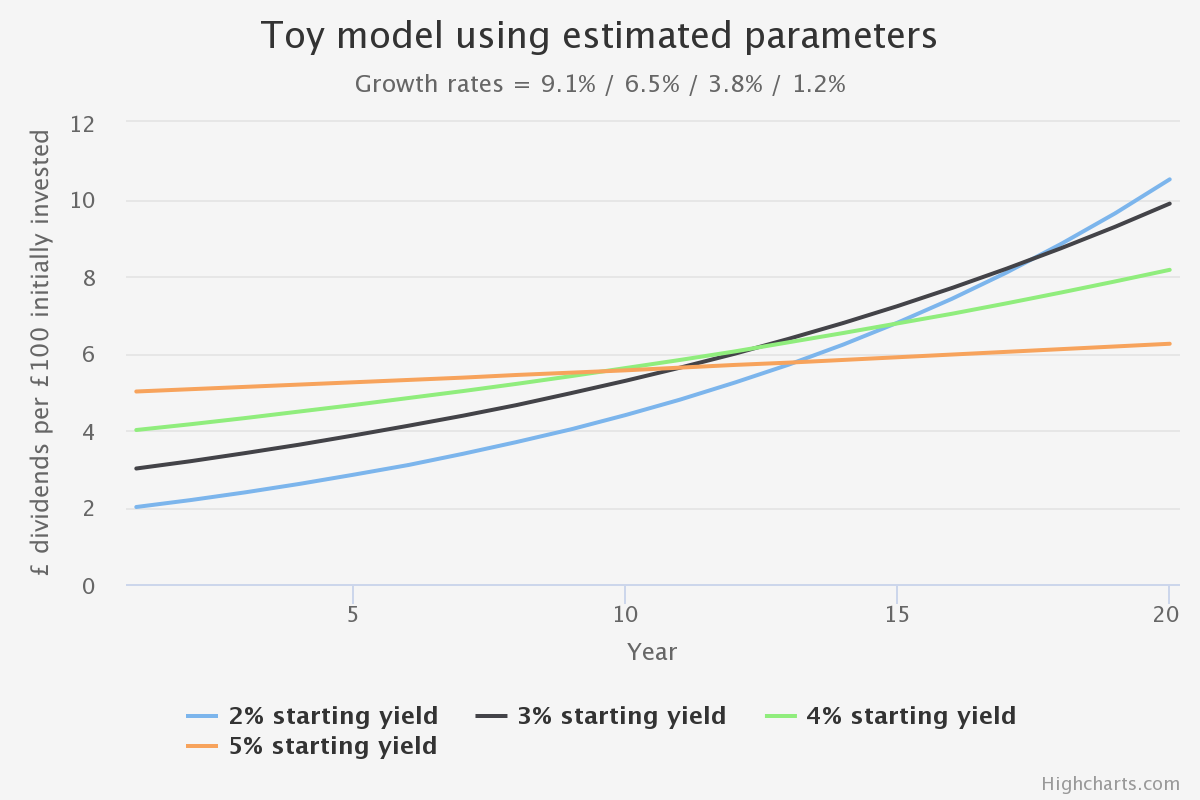
Source: Kepler Partners
Considerations for an investor
As can be seen there is a meaningful trade-off between current and future income with no right answer: a retiree who is 70 years of age would not necessarily be well served by a strategy that delivers higher levels of annual income at a timescale beyond their life expectancy! On the other hand, a long term investor looking to build up a pool of income generating assets to fund a future retirement could well choose to forego present income with a view to enhancing future income streams. This means when selecting a trust for income, there is no right answer, only different tools to achieve different goals.
A portfolio manager that has decided, in conjunction with their boards, to commit to future dividend growth is Troy Asset Management. In both the Securities Trust of Scotland (LSE:STS), a global equity income trust that Troy took over management of in November 2020, andTroy Income & Growth (LSE:TIGT), a UK equity income trust, it was decided to rebase the dividends to allow for more robust and sustainable dividend growth in the future. This dovetails with Troy’s market view that the current dividend/dividend growth dilemma will likely become exacerbated over time due to the diminishing quality and growth prospects of the current large, incumbent, old economy dividend paying companies.
Other trusts have taken an approach of building a ‘barbell’ strategy, mixing in the portfolio allocations to both high dividend paying stocks and stocks with good dividend growth prospects. This can work especially well if the trust has a long track record of dividend growth that the present portfolio can benefit from. As an example, Aberdeen Standard Equity Income Trust (LSE:ASEI) has a greater exposure to small and mid-caps than many of its UK equity income peers, as these smaller companies have a greater capacity for dividend growth. ASEI balances these holdings with some of the stalwarts of UK equity income investing such as Shell and BP. This has resulted in a current yield of 5.8% (as at 03/02/2022) and a dividend growth rate of 6.6% over the last five financial years ending 2021, a case of both having your cake and eating it.
Another trust that is shifting to more of a barbell strategy is BMO UK High Income (LSE:BHI). BHI has been run by Philip Webster since April 2017, and he has transitioned the portfolio from a more traditional approach to UK equity income investing to a highly active and often contrarian style, investing in high-quality, innovative companies with strong growth prospects. BHI benefits from a dual share class structure that allows for a high income yield (6.0% as at 03/02/2022), whilst Philip invests in growth companies. The rotation away from the growth style has been a headwind in the beginning of 2022, however if an investor shares Philip’s investment philosophy it is possible to buy the portfolio at a lower market multiple now than last year, leaving more room for rerating and improved returns if Philip’s stock-picks are astute.
Conclusion
To conclude, the historical data in the UK Equity Income and Global Equity Income does support the investing common knowledge that there is a trade-off between current and future income. For an investor, we think it is important to make careful consideration of whether a trust is tilted towards generating a high yield as soon as possible or is oriented towards dividend growth when selecting an investment, in order to make sure it suits their needs and time horizons. Fortunately, the trust space has a mixture of approaches that should meet most investors’ requirements.
Appendix
y = Subsequent annualised three-year dividend growth rate
x = 12 month yield at beginning of the period
y = x * Coefficient + Intercept
The coefficient used in the calculations is the average of the five three-year sample periods, excluding the pandemic period 2018 – 2021.
Kepler Partners is a third-party supplier and not part of interactive investor. Neither Kepler Partners or interactive investor will be responsible for any losses that may be incurred as a result of a trading idea.
These articles are provided for information purposes only. Occasionally, an opinion about whether to buy or sell a specific investment may be provided by third parties. The content is not intended to be a personal recommendation to buy or sell any financial instrument or product, or to adopt any investment strategy as it is not provided based on an assessment of your investing knowledge and experience, your financial situation or your investment objectives. The value of your investments, and the income derived from them, may go down as well as up. You may not get back all the money that you invest. The investments referred to in this article may not be suitable for all investors, and if in doubt, an investor should seek advice from a qualified investment adviser.
Full performance can be found on the company or index summary page on the interactive investor website. Simply click on the company's or index name highlighted in the article.
Important Information
Kepler Partners is not authorised to make recommendations to Retail Clients. This report is based on factual information only, and is solely for information purposes only and any views contained in it must not be construed as investment or tax advice or a recommendation to buy, sell or take any action in relation to any investment.
This report has been issued by Kepler Partners LLP solely for information purposes only and the views contained in it must not be construed as investment or tax advice or a recommendation to buy, sell or take any action in relation to any investment. If you are unclear about any of the information on this website or its suitability for you, please contact your financial or tax adviser, or an independent financial or tax adviser before making any investment or financial decisions.
The information provided on this website is not intended for distribution to, or use by, any person or entity in any jurisdiction or country where such distribution or use would be contrary to law or regulation or which would subject Kepler Partners LLP to any registration requirement within such jurisdiction or country. Persons who access this information are required to inform themselves and to comply with any such restrictions. In particular, this website is exclusively for non-US Persons. The information in this website is not for distribution to and does not constitute an offer to sell or the solicitation of any offer to buy any securities in the United States of America to or for the benefit of US Persons.
This is a marketing document, should be considered non-independent research and is subject to the rules in COBS 12.3 relating to such research. It has not been prepared in accordance with legal requirements designed to promote the independence of investment research.
No representation or warranty, express or implied, is given by any person as to the accuracy or completeness of the information and no responsibility or liability is accepted for the accuracy or sufficiency of any of the information, for any errors, omissions or misstatements, negligent or otherwise. Any views and opinions, whilst given in good faith, are subject to change without notice.
This is not an official confirmation of terms and is not to be taken as advice to take any action in relation to any investment mentioned herein. Any prices or quotations contained herein are indicative only.
Kepler Partners LLP (including its partners, employees and representatives) or a connected person may have positions in or options on the securities detailed in this report, and may buy, sell or offer to purchase or sell such securities from time to time, but will at all times be subject to restrictions imposed by the firm's internal rules. A copy of the firm's conflict of interest policy is available on request.
Past performance is not necessarily a guide to the future. The value of investments can fall as well as rise and you may get back less than you invested when you decide to sell your investments. It is strongly recommended that Independent financial advice should be taken before entering into any financial transaction.
PLEASE SEE ALSO OUR TERMS AND CONDITIONS
Kepler Partners LLP is a limited liability partnership registered in England and Wales at 9/10 Savile Row, London W1S 3PF with registered number OC334771.
Kepler Partners LLP is authorised and regulated by the Financial Conduct Authority.