eyeQ: why Prudential shares just triggered a bearish signal
Experts at eyeQ have used AI and their own smart machine to analyse macro conditions and generate actionable trading signals. And macro really matters for this stock.
1st October 2025 09:46
by Huw Roberts from eyeQ

Photo: Sheldon Cooper/SOPA Images/LightRocket via Getty Images.
“Our signals are crafted through macro-valuation, trend analysis, and meticulous back-testing. This combination ensures a comprehensive evaluation of an asset's value, market conditions, and historical performance.” eyeQ
- Discover: eyeQ analysis explained | eyeQ: our smart machine in action | Glossary
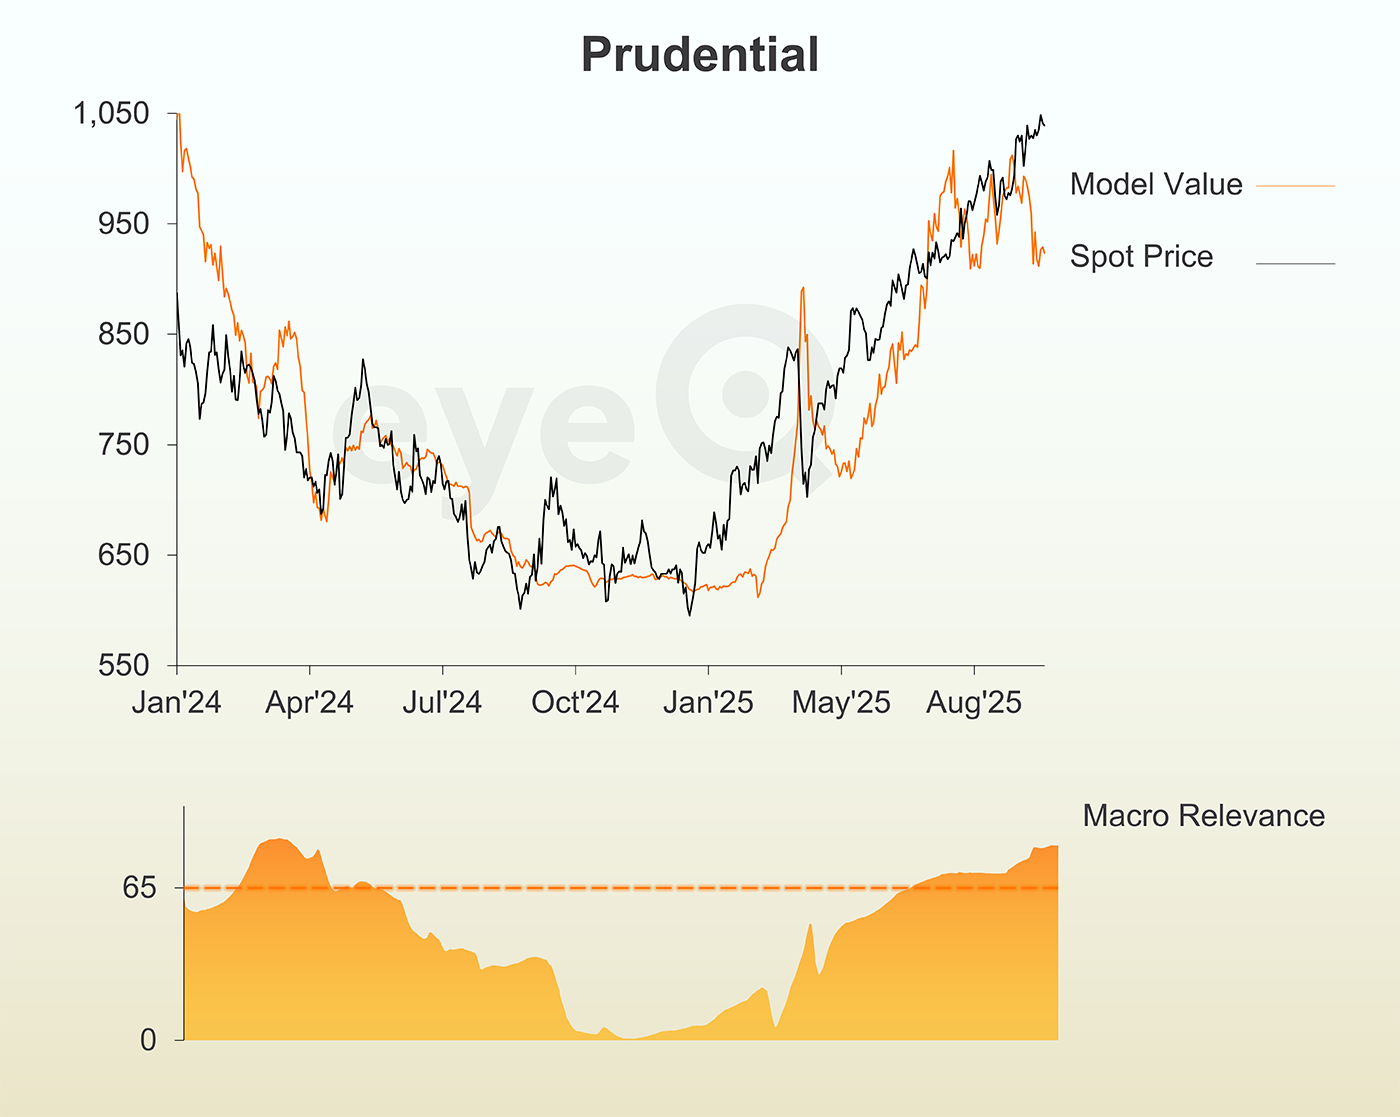
Prudential
Macro Relevance: 83%
Model Value: 915.53p
Fair Value Gap: +12.05% premium to model value
Data correct as at 1 October 2025. Please click glossary for explanation of terms. Long-term strategic model.
For more than a year, insurance giant Prudential (LSE:PRU) was all about micro. Bottom-up analysis of company fundamentals was key to understanding moves in the stock price.
But, in June, our macro relevance score crossed the 65% threshold for a macro regime. Today, macro explains 83% of day-to-day shifts in the stock price. Put another way, macro really matters.
And eyeQ’s model value for the Pru is flatlining. Macro conditions supported a higher stock price for much of 2025 but, since August, that upward momentum has been lost and for two months the broad macro environment has been consistent with the Pru trading in and around the 900p area.
That means the latest rally has not been justified by big-picture stuff such as the outlook for growth and inflation. The result is the Pru sits around 12% rich to macro, which is sufficient to trigger a bearish signal.
Insurers in general are popular picks with retail investors as they historically pay good dividends. Fair enough. But at these levels, the macro risk/reward for Prudential is not great.
Source: eyeQ. Past performance is not a guide to future performance.
Useful terminology:
Model value
Where our smart machine calculates that any stock market index, single stock or exchange-traded fund (ETF) should be priced (the fair value) given the overall macroeconomic environment.
Model (macro) relevance
How confident we are in the model value. The higher the number the better! Above 65% means the macro environment is critical, so any valuation signals carry strong weight. Below 65%, we deem that something other than macro is driving the price.
Fair Value Gap (FVG)
The difference between our model value (fair value) and where the price currently is. A positive Fair Value Gap means the security is above the model value, which we refer to as “rich”. A negative FVG means that it's cheap. The bigger the FVG, the bigger the dislocation and therefore a better entry level for trades.
Long Term model
This model looks at share prices over the last 12 months, captures the company’s relationship with growth, inflation, currency shifts, central bank policy etc and calculates our key results - model value, model relevance, Fair Value Gap.
These third-party research articles are provided by eyeQ (Quant Insight). interactive investor does not make any representation as to the completeness, accuracy or timeliness of the information provided, nor do we accept any liability for any losses, costs, liabilities or expenses that may arise directly or indirectly from your use of, or reliance on, the information (except where we have acted negligently, fraudulently or in wilful default in relation to the production or distribution of the information).
The value of your investments may go down as well as up. You may not get back all the money that you invest.
Equity research is provided for information purposes only. Neither eyeQ (Quant Insight) nor interactive investor have considered your personal circumstances, and the information provided should not be considered a personal recommendation. If you are in any doubt as to the action you should take, please consult an authorised financial adviser.
Disclosure
We use a combination of fundamental and technical analysis in forming our view as to the valuation and prospects of an investment. Where relevant we have set out those particular matters we think are important in the above article, but further detail can be found here.
Please note that our article on this investment should not be considered to be a regular publication.
Details of all recommendations issued by ii during the previous 12-month period can be found here.
ii adheres to a strict code of conduct. Contributors may hold shares or have other interests in companies included in these portfolios, which could create a conflict of interests. Contributors intending to write about any financial instruments in which they have an interest are required to disclose such interest to ii and in the article itself. ii will at all times consider whether such interest impairs the objectivity of the recommendation.
In addition, individuals involved in the production of investment articles are subject to a personal account dealing restriction, which prevents them from placing a transaction in the specified instrument(s) for a period before and for five working days after such publication. This is to avoid personal interests conflicting with the interests of the recipients of those investment articles.