Following the right trend at Puretech Health
This biotech stock has grabbed attention, but what might the future hold? Independent analyst Alistair Strang runs his charts to find out.
21st May 2026 07:43
by Alistair Strang from Trends and Targets

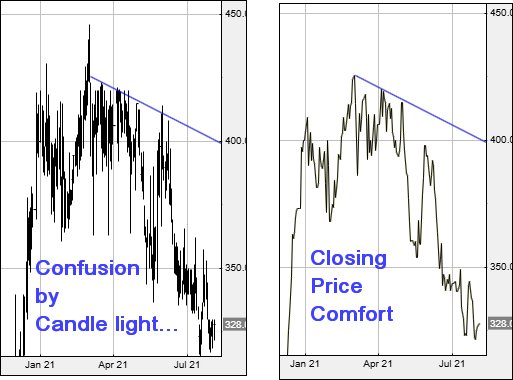
Sometimes we switch to analysis purely by closing price due to the stock market playing games with crazy intraday pricing. PureTech Health were victims of this sort of game in 2021 when from January through to June, the share price suffered bonkers intraday swings, yet the closing prices managed to define a new downtrend.
- Invest with ii:Open a Stocks & Shares ISA | Top ISA Funds | Transfer your ISA to ii
With our usual lack of imagination, it’s the blue line on the chart where, despite the series of mad intraday swings, the market somehow contrived to produce what looks like a planned downtrend. If this is indeed the case, perhaps things are about to become interesting for the share, especially as we’ve received a few emails asking our opinion.
The two chart extracts below highlight, quite nastily, an occasion when intraday candles have the capability of producing a completely wrong trend, one which can be ignored. Instead, a cunning plan was gestating, one which involved the closing price each day.
Source: Trends and Targets. Past performance is not a guide to future performance.
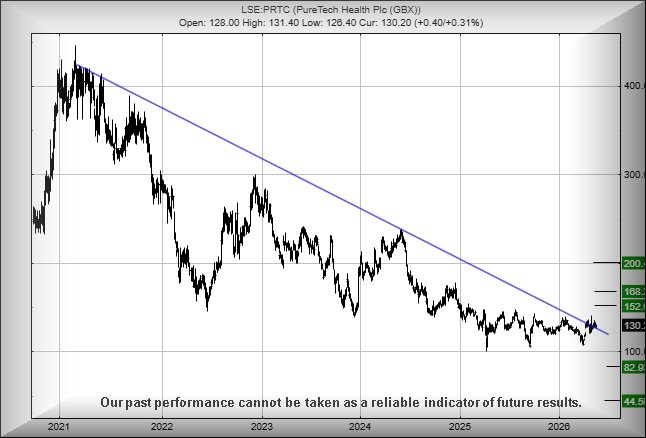
The sort of nonsense above isn’t coincidence. We routinely check trend lines, just to confirm if a share is being mapped by the (usually accurate) high of the day or the (very important) day closing price. Should this be the case, PureTech is being presented as a share where either closure above 136p or intraday traffic above 143p shall be important, hopefully triggering share price recovery to an initial confident 152p with our secondary, if bettered, a longer-term 166p. This secondary is quite a big deal, exposing the share price to a lure at 200p and beyond?
The fly in the ointment comes if the price closes below just 128p as this would utterly foul up our calculations, creating an unpleasant situation where weakness to 82p becomes possible with our secondary, if broken, an ultimate bottom of just 44p, a level before which we’d anticipate a real bounce.
However, the biotechnology company is “real”, doing the research and producing successful drugs. On this alone, we lean toward optimism for the future, though above 200p will require we take a good hard look at the tea leaves.
Source: Trends and Targets. Past performance is not a guide to future performance.
Alistair Strang has led high-profile and "top secret" software projects since the late 1970s and won the original John Logie Baird Award for inventors and innovators. After the financial crash, he wanted to know "how it worked" with a view to mimicking existing trading formulas and predicting what was coming next. His results speak for themselves as he continually refines the methodology.
Alistair Strang is a freelance contributor and not a direct employee of Interactive Investor. All correspondence is with Alistair Strang, who for these purposes is deemed a third-party supplier. Buying, selling and investing in shares is not without risk. Market and company movement will affect your performance and you may get back less than you invest. Neither Alistair Strang or Interactive Investor will be responsible for any losses that may be incurred as a result of following a trading idea.
These articles are provided for information purposes only. Occasionally, an opinion about whether to buy or sell a specific investment may be provided by third parties. The content is not intended to be a personal recommendation to buy or sell any financial instrument or product, or to adopt any investment strategy as it is not provided based on an assessment of your investing knowledge and experience, your financial situation or your investment objectives. The value of your investments, and the income derived from them, may go down as well as up. You may not get back all the money that you invest. The investments referred to in this article may not be suitable for all investors, and if in doubt, an investor should seek advice from a qualified investment adviser.
Full performance can be found on the company or index summary page on the interactive investor website. Simply click on the company's or index name highlighted in the article.