FTSE for Friday: is the blue-chip index a coiled spring?
8th April 2022 07:38
by Alistair Strang from Trends and Targets
With the rebound from its March low having stalled and the FTSE 100 less volatile this week, independent analyst Alistair Strang shares his view of the main UK index both near and long term. He also analyses the chart for the Ripple cryptocurrency.

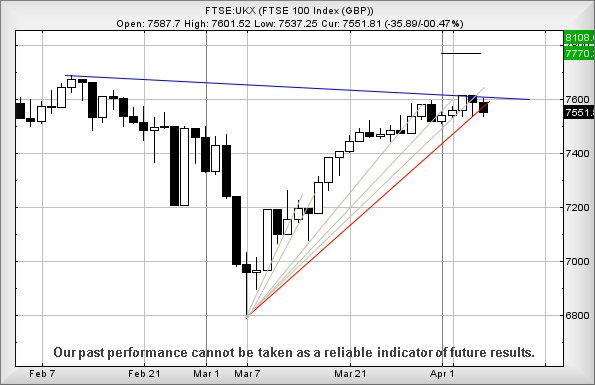
Despite the FTSE 100 proving less than flamboyant recently, market movements during March are giving some hope that the index may indeed bud this spring. Firstly, there’s the issue of the pre-Ukraine invasion high of 7,500 points.
The market has challenged and exceeded this high repeatedly since the third week of March. This tends to suggest the market is poised, simply awaiting good news to exhibit some decent acceleration. From a Big Picture perspective, we continue to show the 8,100 point level as exerting an attraction to the index.
Also, when we review the uptrend since the Russia low of 7 March, on every occasion the market broke its immediate uptrend. It also nudged higher than the level of trend break within a couple of sessions. In addition to telling us the previous uptrend was “tosh”, it also implies hidden strength.
- Nina Kelly's new ISA pick for 2022
- Victoria Scholar's new ISA pick for 2022
- Lee Wild's new ISA share pick for 2022
- Why reading charts can help you become a better investor
Trading around 7,543 points at time of writing, the index only needs better than 7,565 to signal that any immediate reversals should prove short-lived and further uphill nudges are expected. Perhaps importantly, any nod in the right direction now exceeding 7,615 should probably be taken seriously, implying a cycle to 7,770 - with secondary, if bettered, at 8,100 - is commencing.
Source: Trends and Targets. Past performance is not a guide to future performance
From a near-term perspective, the crazy situation remains of us hoping for the best, every time the FTSE does its worst.
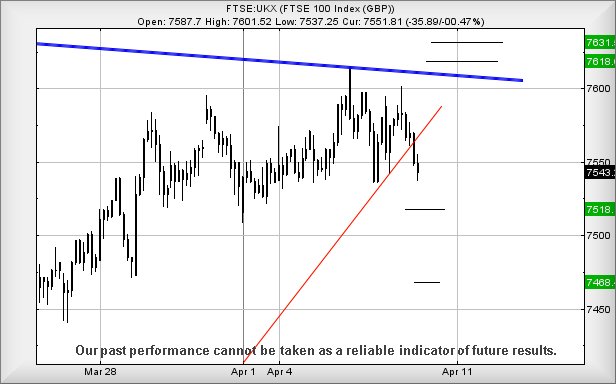
In reality, everything doubtless depends on the Russia/Ukraine situation but a near-term scenario, allowing weakness below 7,536 to make an attack on 7,518, calculates as possible. This presents an early warning that real trouble is coming. Our secondary calculation, should 7,518 break, works out at 7,468 points and hopefully a rebound.
Our converse scenario for gains is proving a little difficult to suggest. The first week of April has seen the market perform in a strange manner, almost as if the Blue downtrend on the chart below is actually a hard and fast rule, something the UK index is prohibited from crossing.
- Richard Hunter's new ISA share pick for 2022
- Sam Benstead's new ISA pick for 2022
- How and where to invest £50k to £250k for income
The immediate situation presents a scenario where above 7,583 points is supposed to inspire movement to an initial 7,618 points. If bettered, our secondary is at 7,631 points.
Neither ambition is particularly stunning but, as both targets come with the implication of a break above Blue, we’re lacking confidence. Unless, of course, something perceived as positive happens with Russia, in which case any near-term movements should rapidly be overwhelmed by the bigger picture taking over.
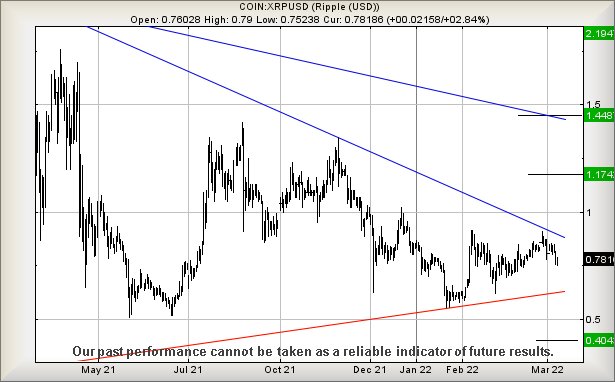
Ripple (XRPUSD)
The last year has seen Ripple behaving in a quite boring fashion but, equally, managing to avoid some of the major pitfalls experienced by popular crypto’s.
Source: Trends and Targets. Past performance is not a guide to future performance
However, as the chart below shows, this is approaching a crisis level, a point where traders will make assumptions should it exceed the Blue downtrend, something which has been quite neatly defined since the start of 2021.
If Ripple decides to make waves and exceed just 0.91, we can calculate the potential of rapid acceleration up to 1.17 next with secondary, if bettered, at a longer term 1.44 and a challenge against the long term downtrend which dates back to 2018.
The market would require travel below 0.63 to give cause for alarm, breaking Red and suggesting an unpleasant bottom target at 0.40.
Source: Trends and Targets. Past performance is not a guide to future performance
Alistair Strang has led high-profile and "top secret" software projects since the late 1970s and won the original John Logie Baird Award for inventors and innovators. After the financial crash, he wanted to know "how it worked" with a view to mimicking existing trading formulas and predicting what was coming next. His results speak for themselves as he continually refines the methodology.
Alistair Strang is a freelance contributor and not a direct employee of Interactive Investor. All correspondence is with Alistair Strang, who for these purposes is deemed a third-party supplier. Buying, selling and investing in shares is not without risk. Market and company movement will affect your performance and you may get back less than you invest. Neither Alistair Strang or Interactive Investor will be responsible for any losses that may be incurred as a result of following a trading idea.
These articles are provided for information purposes only. Occasionally, an opinion about whether to buy or sell a specific investment may be provided by third parties. The content is not intended to be a personal recommendation to buy or sell any financial instrument or product, or to adopt any investment strategy as it is not provided based on an assessment of your investing knowledge and experience, your financial situation or your investment objectives. The value of your investments, and the income derived from them, may go down as well as up. You may not get back all the money that you invest. The investments referred to in this article may not be suitable for all investors, and if in doubt, an investor should seek advice from a qualified investment adviser.
Full performance can be found on the company or index summary page on the interactive investor website. Simply click on the company's or index name highlighted in the article.