Macro picture points to US sweet spot
2nd July 2018 13:17
by Ceri Jones from interactive investor

The calm of May has given way to a big spike in stockmarket volatility. June kicked off with a crisis in Italy, further Brexit setbacks and sinister political antics from Donald Trump. Markets on both sides of the Atlantic are swinging sharply day by day, sometimes on the flimsiest of rationales.
However, the underlying economies of the UK and US are in robust shape, despite the political uncertainty. The UK's economy looks set for growth of up to 0.4% in the second quarter of the year, four times its growth level in the first quarter, according to researchers at IHS Markit. This might provide the Bank of England with the assurance it needs to forge ahead with rate rises to curb inflation. US corporate earnings and the May jobs report were strong. Meanwhile, Trump has delivered on his promised lower taxes and increased deregulation, and both initiatives have been well-received.
After shrugging off crises for months, markets have finally been rattled by the threat of a global trade war.
"Trade wars are good, and easy to win,"
Trump has said. However, his view of the economic interests of the US is crude. Canada, Mexico and China have already announced tit-for-tat tariffs – the latter threatening to target soybeans, as it takes almost a third of the US harvest – while the EU has taken its grievances to the World Trade Organisation.
No-win situation
It is hard to see who can prosper from Trump's petulance. For example, the president's plan to levy a 25% tariff on raw products from China used for US drug manufacture will hit the US generic drugs industry's already-thin margins.
Trump's erratic behaviour magnifies the uncertainty. With his recent flurry of tweets asserting a president's right to pardon himself, Trump's actions are looking more fantastical by the day. Then there is his misleading statement about his son's 2016 meeting with a Russian lawyer, which shows just how effortlessly this septuagenarian can switch from lie to lie.
The president has now fallen out with Emmanuel Macron, one of his few European allies, in a phone call on immigration that happened to take place on the day the US administration announced its decision to levy tariffs on European steel and aluminium imports. By all accounts, Trump flew into a rage when his French counterpart raised objections.
There is one reason for optimism, however: the fact that the Standard & Poor's 500 index has risen in 87% of the fourth quarters of mid-term election years and in the quarters that directly followed. This must be a reaction to market uncertainty in the lead-up to elections, and it's a good reason to hold on to your US exposure until the end of the year.
Small-cap stocks do well in difficult macro-economic climates because they are more domestically focused and are therefore relatively well-insulated from global trade war fears. Indeed, the minnows have held up well in recent weeks, despite the fact that rising interest rates tend to hit smaller firms harder, owing to their relatively high debt levels.
The outlook across the eurozone, in contrast to the picture in the US and UK, has darkened. The German and French economies are slowing. According to Markit's index of activity, France and Germany have dropped to a 16-month and 20-month low respectively. Any stagnation in the eurozone's $10 trillion (£7.4 trillion) economy will have a ripple effect across the globe.
Among developed countries, the UK still looks less expensive than the US and could be worth an over allocation in the medium term, or until Brexit uncertainty clears. Japan is also relatively cheap, and there is potential for strong merger and acquisition activity, as the new trend among huge family conglomerates is to shed peripheral non-core assets. Domestically, the boom in tourism has been spreading wealth to rural areas.
Past performance is not a guide to future performance
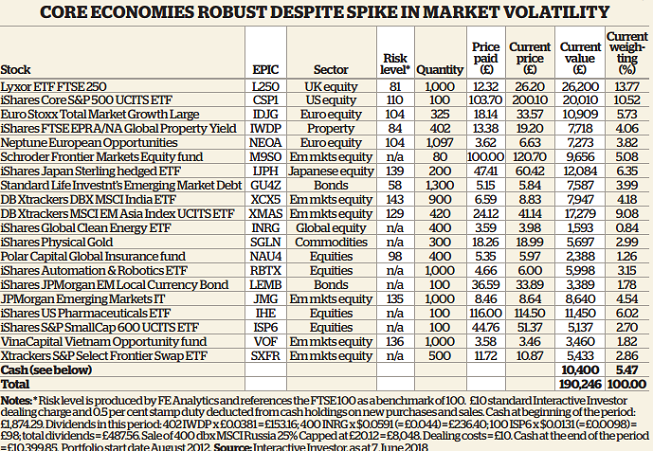
| Stock | EPIC | Sector | Risk Level* | Quantity | Price paid (£) | Current price (£) | Current value (£) | Current weighting (%) |
|---|---|---|---|---|---|---|---|---|
| Lyxor ETF FTSE 250 | L250 | UK equity | 81 | 1000 | 12.32 | 26.20 | 26,200 | 13.77 |
| iShares Core S&P 500 UCITS ETF | CSP1 | US equity | 110 | 100 | 103.70 | 200.10 | 20,010 | 10.52 |
| Euro Stoxx Total Market Growth Large | IDJG | Euro equity | 104 | 325 | 18.14 | 33.57 | 10,909 | 5.73 |
| iShares FTSE EPRA/NA Glbl Prop Yld (2) | IWDP | Property | 84 | 402 | 13.38 | 19.20 | 7,718 | 4.06 |
| Neptune European Opportunities | NEOA | Euro equity | 104 | 1097 | 3.62 | 6.63 | 7,273 | 3.82 |
| Schroder Frontier Markets Equity fund | M9S0 | Em mkts equity | n/a | 80 | 100.00 | 120.70 | 9,656 | 5.08 |
| iShares Japan Sterling hedged ETF | IJPH | Japanese equity | 139 | 200 | 47.41 | 60.42 | 12,084 | 6.35 |
| Standard Life Investments Emerging Market Debt | GU4Z | Bonds | 58 | 1300 | 5.15 | 5.84 | 7,587 | 3.99 |
| DB X-TRACKERS DBX MSCI INDIA ETF | XCX5 | Em mkts equity | 143 | 900 | 6.59 | 8.83 | 7,947 | 4.18 |
| DB X-Trackers MSCI EM Asia Index UCITS ETF | XMAS | Em mkts equity | 129 | 420 | 24.12 | 41.14 | 17,279 | 9.08 |
| iShares Global Clean Energy ETF | INRG | Global equity | n/a | 400 | 3.59 | 3.98 | 1,593 | 0.84 |
| iShares Physical Gold | SGLN | Commodities | n/a | 300 | 18.26 | 18.99 | 5,697 | 2.99 |
| Polar Capital Global Insurance fund | NAU4 | Equities | 98 | 400 | 5.35 | 5.97 | 2,388 | 1.26 |
| iShares Automation & Robotics ETF | RBTX | Equities | n/a | 1000 | 4.66 | 6.00 | 5,998 | 3.15 |
| iShares J.P.Morgan EM Local Currency Bond | LEMB | Bonds | n/a | 100 | 36.59 | 33.89 | 3,389 | 1.78 |
| JPMorgan Emerging Markets IT | JMG | Em mkts equity | 135 | 1000 | 8.46 | 8.64 | 8,640 | 4.54 |
| iShares US Pharmaceuticals ETF | IHE | Equities | n/a | 100 | 116.00 | 114.50 | 11,450 | 6.02 |
| iShares S&P SmallCap 600 UCITS ETF GBP | ISP6 | Equities | n/a | 100 | 44.76 | 51.37 | 5,137 | 2.70 |
| VinaCapital Vietnam Opportunity fund | VOF | Em mkts equity | 136 | 1000 | 3.58 | 3.46 | 3,460 | 1.82 |
| Xtrackers S&P Select Frontier Swap ETF | SXFR | Em mkts equity | n/a | 500 | 11.72 | 10.87 | 5,433 | 2.86 |
| Cash (see below) | 10,400 | 5.47 | ||||||
| Total | 190,246 | 100.00 |
Source: interactive investor Past performance is not a guide to future performance
India's stockmarket has doubled in value in five years. That trend should continue, although only a small minority of companies have fully participated in the country's growth story. Very few Indian corporations dominate their sectors or are world-class exporters, which suggests investors are better off looking for stocks that will benefit from India's strong domestic consumption. The government is likely to try to boost rural incomes next year in the run-up to national elections, and it is also striving for improved transparency by publishing jobs data on tiny firms.
Frontier markets are attractive for those with very long-term horizons. Algeria, Egypt, Morocco, Libya, Tunisia and Vietnam have been building infrastructure, just as India - and indeed China and South Korea - did 50 years ago. All the key data, on literacy and child mortality, for example, has been improving steadily over several years. These markets also appeal because their workforces are young and tech savvy, while businesses are not constrained by legacy systems. They may also offer diversification, as they are less plugged in to the global economy.
Our portfolio has held the Schroder Frontier Markets Equity fund since May 2014 in an attempt to tap into these trends, but the fund has made less than 10% over three years. It is invested 20% in Argentina, 14% in Kuwait, 13% in Egypt, 9% in the UAE and 7.5% in Vietnam, with nearly half in financials, a profile that pretty much mirrors its peers in this space. Last month we added the Xtrackers S&P Select Frontier Swap ETF, so the portfolio's weighting to these markets is sufficient for now.
We are going to sell our Russian Xtracker, following the ratcheting up of political pressure on Russia's president, Vladimir Putin, the most obvious example of which is the delay in issuing Roman Abramovich's Tier 1 UK visa. The upshot will be that Russian and other foreign investors will find it more difficult to obtain objective information about firms they are considering investing in. Putin is unlikely to take it all lying down.
This article was originally published in our sister magazine Money Observer, which ceased publication in August 2020.
These articles are provided for information purposes only. Occasionally, an opinion about whether to buy or sell a specific investment may be provided by third parties. The content is not intended to be a personal recommendation to buy or sell any financial instrument or product, or to adopt any investment strategy as it is not provided based on an assessment of your investing knowledge and experience, your financial situation or your investment objectives. The value of your investments, and the income derived from them, may go down as well as up. You may not get back all the money that you invest. The investments referred to in this article may not be suitable for all investors, and if in doubt, an investor should seek advice from a qualified investment adviser.
Full performance can be found on the company or index summary page on the interactive investor website. Simply click on the company's or index name highlighted in the article.