Novacyt & Unilever: Comparing polar opposite trades
Our chartist looks at these two very different growth curves by analysing key trends.
24th February 2020 08:43
by Alistair Strang from Trends and Targets
Our chartist looks at these two very different growth curves by analysing key trends.

Novacyt & Unilever too! (LSE:NCYT & LSE:ULVR)
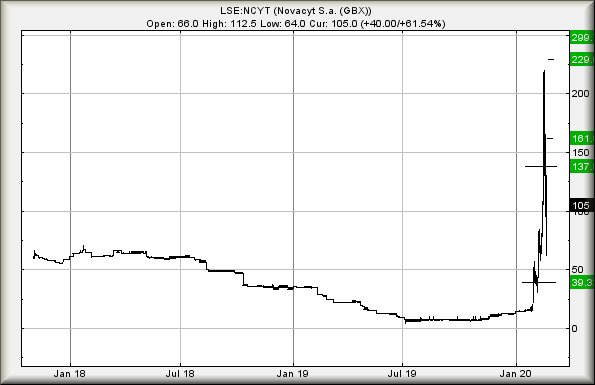
Starting the week with a couple of shares featured in our emails couldn't produce two utterly different trade histories. Unilever (LSE:ULVR), currently a boring 46 quid and Novacyt (LSE:NCYT) showing a vibrant 106p.
Despite our previous glance at Novacyt forcing us to admit would couldn't calculate at 124p, the share price cheerfully ignored all our calculations, managing to spend a couple of sessions at nearly 220p.
One side effect of this buoyant behaviour is to allow some wild price swings, making the concept of a "stop loss" virtually impossible. At time of writing, NCYT are trading at around 106p, needing above just 114p to apparently trigger movements toward an initial 137p.
If exceeded, secondary is a visually pleasing 161p though, to be honest, if the company produce positive news (or internet chat rooms provoke positive vibes) the share price could now attempt 229p.
Unfortunately, there's another side to this optimism. The price only needs below 62p to enter a cycle with a bottom (hopefully) at 39p. We cannot calculate below such a level.
Source: Trends and Targets Past performance is not a guide to future performance
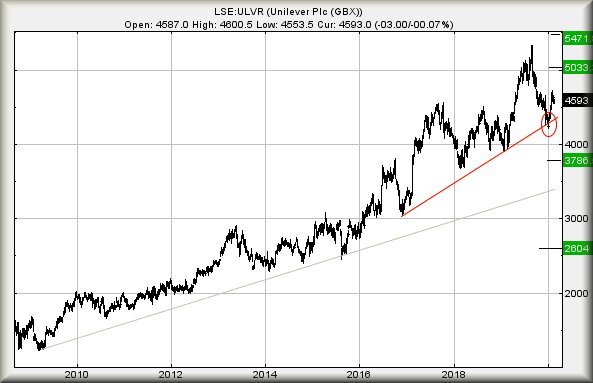
With a growth curve which is rather more conventional than Novacyt's, Unilever is no less spectacular and it seems a few folk invested since the lows of 2009 are starting to question if it's the time to take some profit. Perhaps it was the blip below the uptrend on July 8th giving slight concern?
All to often, this sort of signal (circled) does provide early warning for trouble ahead but sometimes, it can 'simply' be the case of the market opting to capture a short position prior to a near term rise. After all, the market is in business to make money and is never charitable!
However, our take on the blip downward suggests it wasn't a warning of evil times ahead, instead it appears more possible movement next above 4,730p shall see the share price rise to 5,033p. If bettered, our secondary calculation comes in at 5,471p and a new all-time high.
Visually, an attempt at the 50 quid level is believable but we suspect the secondary of 5,471p shall need positive FTSE 100 conditions to make it a reality.
If trouble is planned, now below 4,310p shall give ample cause for concern, taking the price into a region where an initial drop to 3,786p is expected.
If broken, secondary calculates at a less likely bottom of 2,604p.
In summary, we're inclined to believe 50 quid as possible on the immediate trading cycle, but suspect beyond such a level will be difficult, at least until the Brexit hiatus is complete.
Source: Trends and Targets Past performance is not a guide to future performance
Alistair Strang has led high-profile and "top secret" software projects since the late 1970s and won the original John Logie Baird Award for inventors and innovators. After the financial crash, he wanted to know "how it worked" with a view to mimicking existing trading formulas and predicting what was coming next. His results speak for themselves as he continually refines the methodology.
Alistair Strang is a freelance contributor and not a direct employee of Interactive Investor. All correspondence is with Alistair Strang, who for these purposes is deemed a third-party supplier. Buying, selling and investing in shares is not without risk. Market and company movement will affect your performance and you may get back less than you invest. Neither Alistair Strang or interactive investor will be responsible for any losses that may be incurred as a result of following a trading idea.
Alistair Strang has led high-profile and "top secret" software projects since the late 1970s and won the original John Logie Baird Award for inventors and innovators. After the financial crash, he wanted to know "how it worked" with a view to mimicking existing trading formulas and predicting what was coming next. His results speak for themselves as he continually refines the methodology.
Alistair Strang is a freelance contributor and not a direct employee of Interactive Investor. All correspondence is with Alistair Strang, who for these purposes is deemed a third-party supplier. Buying, selling and investing in shares is not without risk. Market and company movement will affect your performance and you may get back less than you invest. Neither Alistair Strang or Interactive Investor will be responsible for any losses that may be incurred as a result of following a trading idea.
These articles are provided for information purposes only. Occasionally, an opinion about whether to buy or sell a specific investment may be provided by third parties. The content is not intended to be a personal recommendation to buy or sell any financial instrument or product, or to adopt any investment strategy as it is not provided based on an assessment of your investing knowledge and experience, your financial situation or your investment objectives. The value of your investments, and the income derived from them, may go down as well as up. You may not get back all the money that you invest. The investments referred to in this article may not be suitable for all investors, and if in doubt, an investor should seek advice from a qualified investment adviser.
Full performance can be found on the company or index summary page on the interactive investor website. Simply click on the company's or index name highlighted in the article.