Oil price analysis and Pantheon Resources
2nd November 2018 11:11
by Rajan Dhall from interactive investor
Financial markets analyst Rajan Dhall picks out the day's key industry news and runs the numbers to see what this share price might do next.

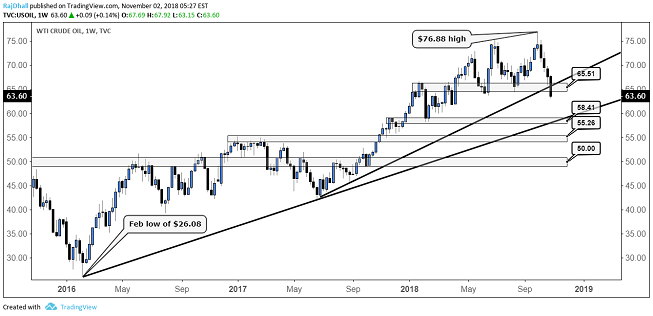
Oil markets had their biggest monthly fall for two years in October, which follows a great run from the February 2016 low of $26.06 to the recent October high of $76.88 per barrel.
Although the longer-term sentiment is bullish, in recent times some of the geopolitical catalysts for price rises have dissipated. Today, oil traders and investors are concerned with the production levels from some of the major oil producing nations.
This week we have seen builds in both API and Department of Energy (DoE) inventory levels. After falling 300,000 barrels last week, this time out US production hit a record 11.3 million barrels per day (bpd).
Given the Russian Ministry of Energy estimated August production of 11.2 million bpd, the United States is the leading crude oil producer in the world. Elsewhere, OPEC boosted oil production in October to 33.31 million barrels per day (bpd), up 390,000 bpd from September and the highest by OPEC since December 2016.

Source: TradingView (*) Past performance is not a guide to future performance
Pantheon Resources
A short update from Pantheon Resources reveals the pipeline connecting the VOS#1 well and the enterprise gathering and processing system in Tyler County, East Texas, have been hooked up and flowing operations have begun.
Pantheon intends to bring the well online slowly to allow it to gradually clean up as a result of a prolonged shut-in period. It will report flow rates in due course.
Chief executive Jay Cheatham said: "Despite the ongoing rain and localised flooding in the area, the crews worked overtime under poor conditions to complete the tie in.
"I am very pleased that we should benefit from strong natural gas prices as we head into the winter heating season and look forward to announcing the stabilised flow rates".
Chart analysis
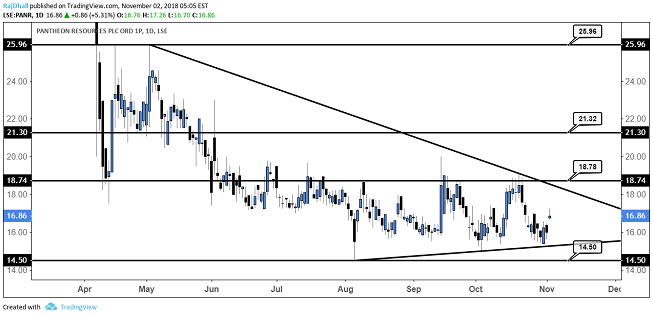
As you can see from the daily chart below, we gapped higher off the back of today's news. The share price has really been struggling over the past year, so I'm sure investors are welcoming some relief.
Longer term, the 18.78p resistance level is the one to watch out for. A break here - an area which acted as resistance in mid-September and October - would be a strong indication that we could be heading much higher.

Source: TradingView (*) Past performance is not a guide to future performance
Rajan Dhall is a freelance contributor and not a direct employee of interactive investor.
These articles are provided for information purposes only. Occasionally, an opinion about whether to buy or sell a specific investment may be provided by third parties. The content is not intended to be a personal recommendation to buy or sell any financial instrument or product, or to adopt any investment strategy as it is not provided based on an assessment of your investing knowledge and experience, your financial situation or your investment objectives. The value of your investments, and the income derived from them, may go down as well as up. You may not get back all the money that you invest. The investments referred to in this article may not be suitable for all investors, and if in doubt, an investor should seek advice from a qualified investment adviser.
Full performance can be found on the company or index summary page on the interactive investor website. Simply click on the company's or index name highlighted in the article.