Oil stock chart analysis: Chariot Oil & Gas
28th September 2018 11:07
by Rajan Dhall from interactive investor
Financial markets analyst Rajan Dhall picks out the day's key industry news and runs the numbers to see what this share price might do next.

Oil markets are trading positively this week and it's looking like we will have a higher weekly close on the charts.
One of the main catalysts for the move higher was the US energy secretary Rick Perry stating that the US is not looking to release some of their SPR (strategic petroleum reserve) to decrease the price of oil.
Interestingly, we also had reports that Saudi Arabia are looking to increase production by some 200-300,000 barrels per day to counter some issues from the Iranian sanctions. This did little to dampen prices, as spot WTI still trades above the all-important $70 a barrel mark at $72.27 today. Brent crude remains above $80 per barrel at $81.40.
However, concerns about Iran have led to the Brent-WTI spread widening once again.
Chariot Oil & Gas
Chariot Oil & Gas has announced that the Ocean Rig Poseidon, a sixth generation deepwater drillship, has begun mobilisation with estimated arrival at the Prospect S well in Namibia in the next 24 hours.
Operations are expected to take around 40 days and we'll get further updates when appropriate.
Prospect S, has been independently estimated as a gross mean prospective resource of 459 million barrels (mmbbls) and a probability of geologic success of 29% by Netherland Sewell Associated Inc.
On September 12th, the company released its first-half results for 2018 and noted that the cash position remained robust at US$28.4 million, with no debt and all commitments fully funded.
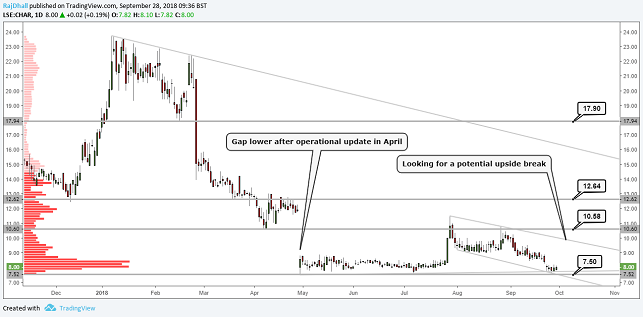
Looking at the daily chart, prices have consolidated in a descending flag pattern. Look for a break of the pattern – currently at just under the 10p mark - to indicate a move to higher historical levels.
Above the current price, there are some prominent resistance levels to keep an eye out for, with 10.58p being a solid target, as this is the consolidation low from where the gap down originated in late April.

Past performance is not a guide to future performance
Rajan Dhall is a freelance contributor and not a direct employee of interactive investor.
These articles are provided for information purposes only. Occasionally, an opinion about whether to buy or sell a specific investment may be provided by third parties. The content is not intended to be a personal recommendation to buy or sell any financial instrument or product, or to adopt any investment strategy as it is not provided based on an assessment of your investing knowledge and experience, your financial situation or your investment objectives. The value of your investments, and the income derived from them, may go down as well as up. You may not get back all the money that you invest. The investments referred to in this article may not be suitable for all investors, and if in doubt, an investor should seek advice from a qualified investment adviser.
Full performance can be found on the company or index summary page on the interactive investor website. Simply click on the company's or index name highlighted in the article.