Is this the price where Vistry shares bounce?
After a crash to 13-year lows, independent analyst Alistair Strang reveals at which level his charts say shares in the hard-hit housebuilder should rebound.
10th March 2026 07:46
by Alistair Strang from Trends and Targets

There’s a classic set of circumstances for share prices, when a company reports something punters feel is positive, yet the share price crashes. Vistry Group (LSE:VTY) managed this neat trick, their price dropping 25.6% after reporting an impressive rise in profits, despite completing fewer development completions within the full year being reported. And their boss announced his retirement, freeing the company up for younger more dynamic management, a concept which will probably prove to be utter nonsense.
- Invest with ii:Open a Stocks & Shares ISA | Top ISA Funds | Transfer your ISA to ii
Of course, while the stock market certainly pays attention to historical results, it’s also likely to throw a hissy fit if a set of numbers includes mention of future reduced margins, along with the potential of future “challenges”.
Share prices are obviously predicated on future potentials for a company rather than something they’ve already done! Investors often have a severe problem with such a concept, failing to comprehend a share price is more attracted to the future than the past.
The current tantrum being pulled by Vistry's share price isn’t particularly pleasant, with movement below 421p calculating with the potential of reversal down to an initial 376p with our secondary, if broken, working out at a grim looking 281p.
The funny thing is, our 376p calculation is being promoted as a very possible “bottom”, a price level from which a bounce should be anticipated. This is where life gets interesting.
The share price “only” needs to exceed 504p on a bounce to inject substantial hope for the future, propelling the price above red on the chart, giving a confident looking ambition at an initial 557p with our secondary, if beaten, working out at a pretty happy value of 630p.
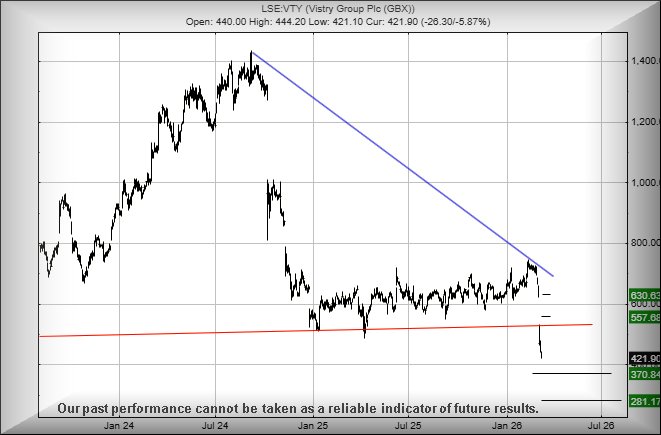
Source: Trends and Targets. Past performance is not a guide to future performance.
Alistair Strang has led high-profile and "top secret" software projects since the late 1970s and won the original John Logie Baird Award for inventors and innovators. After the financial crash, he wanted to know "how it worked" with a view to mimicking existing trading formulas and predicting what was coming next. His results speak for themselves as he continually refines the methodology.
Alistair Strang is a freelance contributor and not a direct employee of Interactive Investor. All correspondence is with Alistair Strang, who for these purposes is deemed a third-party supplier. Buying, selling and investing in shares is not without risk. Market and company movement will affect your performance and you may get back less than you invest. Neither Alistair Strang or Interactive Investor will be responsible for any losses that may be incurred as a result of following a trading idea.
These articles are provided for information purposes only. Occasionally, an opinion about whether to buy or sell a specific investment may be provided by third parties. The content is not intended to be a personal recommendation to buy or sell any financial instrument or product, or to adopt any investment strategy as it is not provided based on an assessment of your investing knowledge and experience, your financial situation or your investment objectives. The value of your investments, and the income derived from them, may go down as well as up. You may not get back all the money that you invest. The investments referred to in this article may not be suitable for all investors, and if in doubt, an investor should seek advice from a qualified investment adviser.
Full performance can be found on the company or index summary page on the interactive investor website. Simply click on the company's or index name highlighted in the article.