Rolls-Royce and the odds of a chart breakout
Stuck in a range since the start of 2026, independent analyst Alistair Strang studies the charts for an indication that the shares might reach a new high.
18th February 2026 07:52
by Alistair Strang from Trends and Targets
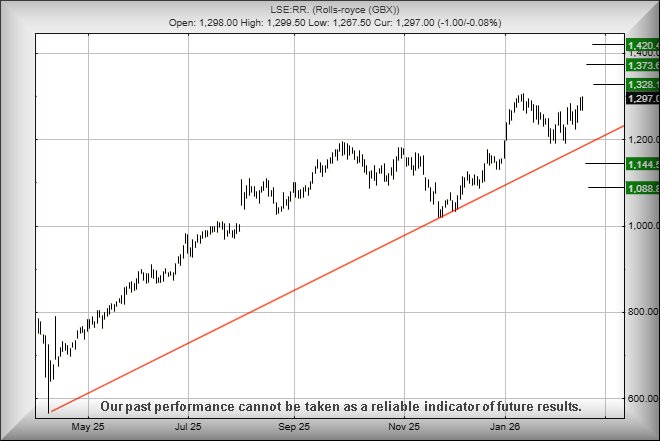
Rolls-Royce Holdings (LSE:RR.) shares have been mucking around since the start of this year, pretending to be rangebound between £12-13. Perhaps in a couple of days, the share shall exhibit a proper sense of direction, needing only above 1,307p to introduce the concept of even further growth ahead.
- Invest with ii:Open a Stocks & Shares ISA | Top ISA Funds | Transfer your ISA to ii
To a degree, the share price has been in “difficult” territory since May 2025. In April, we’d produced 856p as a “top” target, a price level we’d some difficulty in calculating above. By the end of May, the share price closed above 856p, entering uncharted territory and grudgingly increasing in price by over 50%!
It has been pretty impressive and perhaps a reflection on the company's work with nuclear power, their small modular reactors already approved for us in the USA and going through the mill in Europe.
Currently, with a financial report due on 26th of this month, there’s a reasonable chance Rolls-Royce shall display another upward surge. Certainly, since 13 January, the market has almost hired a billboard saying “The £13 Level is Sacrosanct” and, therefore, anything above the prior high of 1,307p should be significant, allowing for movement to an initial 1,328p with our secondary, if bettered, at 1,373p.
Overall, from a Big Picture perspective, we can introduce a potential high of 1,420p, this being the point we can once again no longer calculate above. As shown historically with our 856p level, the concept of “maximum” means nothing to the market where Rolls is concerned, other than the possibility of introducing a price level which may cause brief hesitation.
As always, we must speculate on the curse of the final paragraph, asking what happens if RR stumbles below £12 quid.
In such a scenario, below 1,200p risks triggering reversal to an initial 1,144p with our secondary, if broken, at 1,088p. For now, we feel more gains are expected. Soon.
Source: Trends and Targets. Past performance is not a guide to future performance.
Alistair Strang has led high-profile and "top secret" software projects since the late 1970s and won the original John Logie Baird Award for inventors and innovators. After the financial crash, he wanted to know "how it worked" with a view to mimicking existing trading formulas and predicting what was coming next. His results speak for themselves as he continually refines the methodology.
Alistair Strang is a freelance contributor and not a direct employee of Interactive Investor. All correspondence is with Alistair Strang, who for these purposes is deemed a third-party supplier. Buying, selling and investing in shares is not without risk. Market and company movement will affect your performance and you may get back less than you invest. Neither Alistair Strang or Interactive Investor will be responsible for any losses that may be incurred as a result of following a trading idea.
These articles are provided for information purposes only. Occasionally, an opinion about whether to buy or sell a specific investment may be provided by third parties. The content is not intended to be a personal recommendation to buy or sell any financial instrument or product, or to adopt any investment strategy as it is not provided based on an assessment of your investing knowledge and experience, your financial situation or your investment objectives. The value of your investments, and the income derived from them, may go down as well as up. You may not get back all the money that you invest. The investments referred to in this article may not be suitable for all investors, and if in doubt, an investor should seek advice from a qualified investment adviser.
Full performance can be found on the company or index summary page on the interactive investor website. Simply click on the company's or index name highlighted in the article.