Stockwatch: buy the dip, or sell the drop?
This mid-cap has been clobbered unreasonably in the war-driven sell-off, writes analyst Edmond Jackson, who offers an update after tipping it a few months ago.
2nd April 2026 10:48
by Edmond Jackson from interactive investor

Various commentators have expressed surprise at the extent of the drop in electrical retailer Currys (LSE:CURY) shares.
Not only did the price fall sharply from an eight-year high of 161p before Middle East war kicked off, just over a week ago the FTSE 250 company was down 8% at 121p in response to news that the CEO would be standing down after eight years. This is to take on a new external position rather than any issue with his stewardship.
- Invest with ii: SIPP Account | Stocks & Shares ISA | See all Investment Accounts
In response, on 27 March, a non-executive director appointed last September used the drop to make a maiden share-purchase: a material £59,245 worth at 118.5p, even if it is part of the convention for new such directors to buy.
That, however, is the only cash buy since another non-executive director bought £31,342 at 89.6p. Otherwise, insiders’ trading has involved executives exercising options and selling what shares necessary to meet tax arising.
Does this show the ultimate unreliability of ‘bowl’ charts?
They are said to be profoundly bullish in that previous negative sentiment reverses after a long fall, with improving fundamentals creating a mutually supportive uptrend. Currys is a classic example where you could say that the bowl pattern is intact even after this latest drop; hence buy it.
Indeed, recovery continued yesterday from 118p, the shares up 3p to 128p albeit in a strong market:
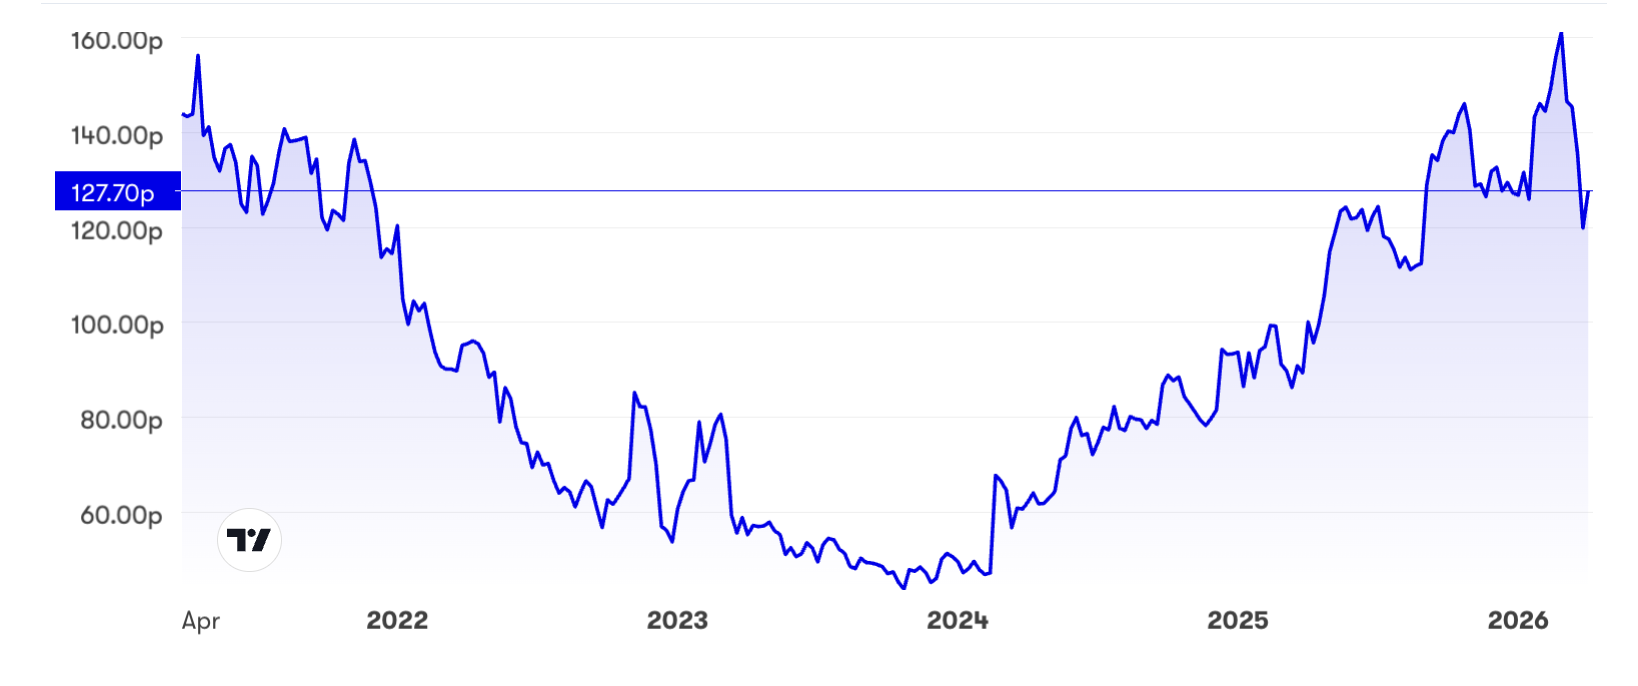
Source: interactive investor. Past performance is not a guide to future performance.
Superficially (I would say) then, it looks good. Currys has been clobbered unreasonably in the war-driven sell-off and with the shares on a forward price/earnings (PE) possibly around 10x reducing to 9x, a forward PEG slightly below 1.0, there looks to be value on an earnings view.
When I wrote on various retailers last December, I continued to favour Currys at 129p as its story from the Nordics – 42% of revenue – had radically improved with interim sales up 7% at constant currency versus the UK up 6%. I had originally drawn attention to it as a “buy” at 57p in May 2023 given Currys’ strong position in consumer electrical retail.
- FTSE 100: big winners and losers in worst month since Covid
- Shares for the future: a FTSE 100 firm whose qualities will prevail
Now, I feel essential fundamentals are changing and override market technical factors such as the “bowl” chart. It is less the departure of the CEO – people can change job for reasons other than perceived upside in share options – than the UK consumer environment unfolding, and specifically importing routes being compromised from China, by Iran and its Houthi proxies.
The UK consumer outlook is worsening since December
It may be that the UK is more at risk than the Nordics, but imminently consumers are going to feel the effects of inflation globally – with an effect on discretionary spending items.
Last December, it appeared from Currys’ strong interim results, that enough people were experiencing pay rises enough to meet or beat inflation. More recently, the hope has been for an interest rate cut in March and reduced fuel bills, to sustain retailers’ momentum. It could be that central banks hold off from the rate rises initially feared due to the inflationary effects of Middle East war on energy prices. But discretionary spending – for example, mobile phone upgrades – does look at risk.
The Food and Drink Federation (FDF) now anticipates UK food and non-alcoholic drink inflation to rise over 9% by December - due to the Iran war – versus a previous expectation of it easing to 3.2%. If a fair prediction, I cannot see how it doesn’t have some commensurate effect on discretionary spending.
The FDF forecast even assumes the Strait of Hormuz will re-open to cargo traffic within two to three weeks and key facilities such as oil, gas and fertiliser will return to normal within a year. I don’t share such optimism, implicitly also with the way markets are rebounding, but Brent oil up 7% this morning at near $107 a barrel accords with my view of how energy and shipping prospects remain perilous.
- Five AIM growth shares for your ISA in 2026
- Stockwatch: has this canny short seller made the right call?
The US has made a horrific mess in the Middle East – yet again, even worse this time – by inflaming Iran without achieving said regime change of a militant theocracy. Revenge will follow via Iran’s stranglehold on the Strait or Hormuz, also its Houthi proxies’ influence on Red Sea shipping risks. US President Donald Trump’s best offer to US allies is telling them to “take” the Strait.
Can ‘buy the drop’ – generally - work this time?
I believe a key reason markets rebounded in the last week is because they are so conditioned to “buy the drop” since the 2008 crisis - likewise Covid - prompted massive stimulus measures by central banks and governments. Similarly, it worked a year ago when President Trump declared humungous “reciprocal tariffs” it proved somewhat as a negotiating tool.
Such social conditioning was bound to repeat although it looked a flimsy assumption to me – trusting Trump’s reassurances in recent days that the war will soon end satisfactorily.
One is reminded of “the problem of induction” exemplified by the happy pig that assumes the appearance of the farmer each morning guarantees food. One day it gets slaughtered.
Is this all enough to compromise Currys’ momentum?
While I noted at last December’s interims that dynamics of growth relied heavily on adjusted numbers – and you can see from the table there is disparity between reported and normalised earnings per share (EPS) – sales progress was not in doubt.
Currys - financial summary
Year-end 3 May
| 2017 | 2018 | 2019 | 2020 | 2021 | 2022 | 2023 | 2024 | 2025 | |
| Turnover (£ million) | 10,242 | 10,525 | 10,433 | 10,170 | 10,330 | 10,122 | 8,874 | 8,476 | 8,706 |
| Operating profit (£m) | 436 | 321 | -225 | -30.0 | 136 | 220 | -364 | 117 | 198 |
| Net profit (£m) | 295 | 166 | -320 | -163 | 12.0 | 71.0 | -481 | 165 | 108 |
| Operating margin (%) | 4.3 | 3.1 | -2.2 | -0.3 | 1.3 | 2.2 | -4.1 | 1.4 | 2.3 |
| Reported earnings/share (p) | 26.6 | 20.3 | -26.8 | -13.9 | 0.0 | 6.0 | -44.6 | 2.4 | 9.5 |
| Normalised earnings/share (p) | 31.7 | 26.0 | 21.3 | 10.4 | 17.1 | 15.7 | -14.0 | 18.1 | 15.8 |
| Operational cashflow/share (p) | 31.4 | 26.9 | 24.7 | 50.4 | 70.7 | 36.4 | 24.5 | 32.4 | 40.0 |
| Capital expenditure/share (p) | 21.0 | 16.1 | 14.3 | 16.5 | 10.2 | 11.3 | 10.1 | 4.3 | 6.8 |
| Free cashflow/share (p) | 10.5 | 10.8 | 10.4 | 33.9 | 60.5 | 25.1 | 14.4 | 28.2 | 33.2 |
| Dividend per share (p) | 11.3 | 11.3 | 6.8 | 2.3 | 3.0 | 3.2 | 1.0 | 0.0 | 2.8 |
| Covered by earnings (x) | 2.4 | 1.8 | -4.0 | -6.2 | 0.0 | 1.9 | 0.0 | 0.0 | 3.4 |
| Return on total capital (%) | 9.4 | 7.0 | -5.5 | -0.6 | 3.2 | 5.2 | -10.5 | 3.7 | 6.2 |
| Cash (£m) | 147 | 168 | 622 | 628 | 140 | 96.0 | 67.0 | 89.0 | 179 |
| Net debt (£m) | 333 | 309 | 308 | 1,680 | 1,192 | 1,253 | 1,360 | 943 | 786 |
| Net assets (£m) | 3,055 | 3,196 | 2,640 | 2,280 | 2,381 | 2,501 | 1,892 | 2,072 | 2,243 |
| Net assets per share (p) | 265 | 276 | 228 | 196 | 204 | 221 | 167 | 183 | 198 |
Source: historic company REFS and company accounts.
A 21 January update in respect of the 10 weeks ended 10 January cited like-for-like revenue up 6%, helped by 12% growth in the Nordics alongside 3% in the UK and Ireland. Market share gains were achieved with strong sales in mobile alongside computing and appliances, but how durable is such a trend henceforth? Holders may still be able to take heart that the Nordics continue relatively positively versus the UK.
Trading has now been declared “in line with expectations” albeit essentially affirming the upgrade just over two months ago, hence I do not interpret it as a softening. For the current financial year to 2 May, an 11-17% rise in adjusted pre-tax profit is expected, albeit guiding for a relatively narrow range of £180-190 million.
- ii view: is Currys a potential AI winner?
- Sign up to our free newsletter for investment ideas, latest news and award-winning analysis
Consensus translates this into a £138 million net profit, rising to £149 million to May 2027. Is that fair if discretionary spending deteriorates? With the shares down 2p or so this morning to 125p, the prospective yield is only 2.2%, hardly a prop. While earnings cover of 5x is on a normalised basis, the table does show a very strong cash-flow profile with modest capital expenditure needs.
Data summaries say the shares trade at just 0.6x net asset value but the 1 November balance sheet showed goodwill and intangibles at 110% of £2,243 million net assets.
Investor perception of Currys therefore seems liable to default to near-term earnings, which can vary anyway.
With a modest PE and no debt beyond £900 million leases, the shares don’t seem especially exposed even to recession. But the logic of my macro argument implies a complacent deceit to conclude “hold”. I believe retail shares affected by discretionary spending need a kick of the tyres and the appropriate stance is to protect at least some gains. “Sell” need not imply 100%.
Edmond Jackson is a freelance contributor and not a direct employee of interactive investor.
These articles are provided for information purposes only. Occasionally, an opinion about whether to buy or sell a specific investment may be provided by third parties. The content is not intended to be a personal recommendation to buy or sell any financial instrument or product, or to adopt any investment strategy as it is not provided based on an assessment of your investing knowledge and experience, your financial situation or your investment objectives. The value of your investments, and the income derived from them, may go down as well as up. You may not get back all the money that you invest. The investments referred to in this article may not be suitable for all investors, and if in doubt, an investor should seek advice from a qualified investment adviser.
Full performance can be found on the company or index summary page on the interactive investor website. Simply click on the company's or index name highlighted in the article.
Disclosure
We use a combination of fundamental and technical analysis in forming our view as to the valuation and prospects of an investment. Where relevant we have set out those particular matters we think are important in the above article, but further detail can be found here.
Please note that our article on this investment should not be considered to be a regular publication.
Details of all recommendations issued by ii during the previous 12-month period can be found here.
ii adheres to a strict code of conduct. Contributors may hold shares or have other interests in companies included in these portfolios, which could create a conflict of interests. Contributors intending to write about any financial instruments in which they have an interest are required to disclose such interest to ii and in the article itself. ii will at all times consider whether such interest impairs the objectivity of the recommendation.
In addition, individuals involved in the production of investment articles are subject to a personal account dealing restriction, which prevents them from placing a transaction in the specified instrument(s) for a period before and for five working days after such publication. This is to avoid personal interests conflicting with the interests of the recipients of those investment articles.