Stockwatch: time to take profits in Vodafone?
The FTSE 100 firm has just issued an update, and analyst Edmond Jackson says a key market will be influential in the potential for further upside.
6th February 2026 11:25
by Edmond Jackson from interactive investor
The Vodafone logo on one of the company’s stores in London. Photo: Carlos Jasso/AFP via Getty Images.
Shares in FTSE 100 firm Vodafone Group (LSE:VOD) certainly joined the party last year and early this, soaring 75% from a 65p low last April after US President Donald Trump announced his tariffs, to a 114p high on 4 February that hasn't been seen since 2022.
- Invest with ii: SIPP Account | Stocks & Shares ISA | See all Investment Accounts
It manifests yet another classic “bowl” chart with momentum gathering since last year, despite high levels of political uncertainty and trade tensions.
However, Vodafone closed down 5% yesterday after an update for its third quarter to end-December cited 3% overall revenue growth, slightly below expectations and flat adjusting for inflation.
Question marks remain over Germany, Vodafone’s largest market, although Africa appears to have momentum with double-digit profit growth. It came across as a better “mixed bag” than we have heard enough times before, if hard to expect it to sustain a recently parabolic chart:
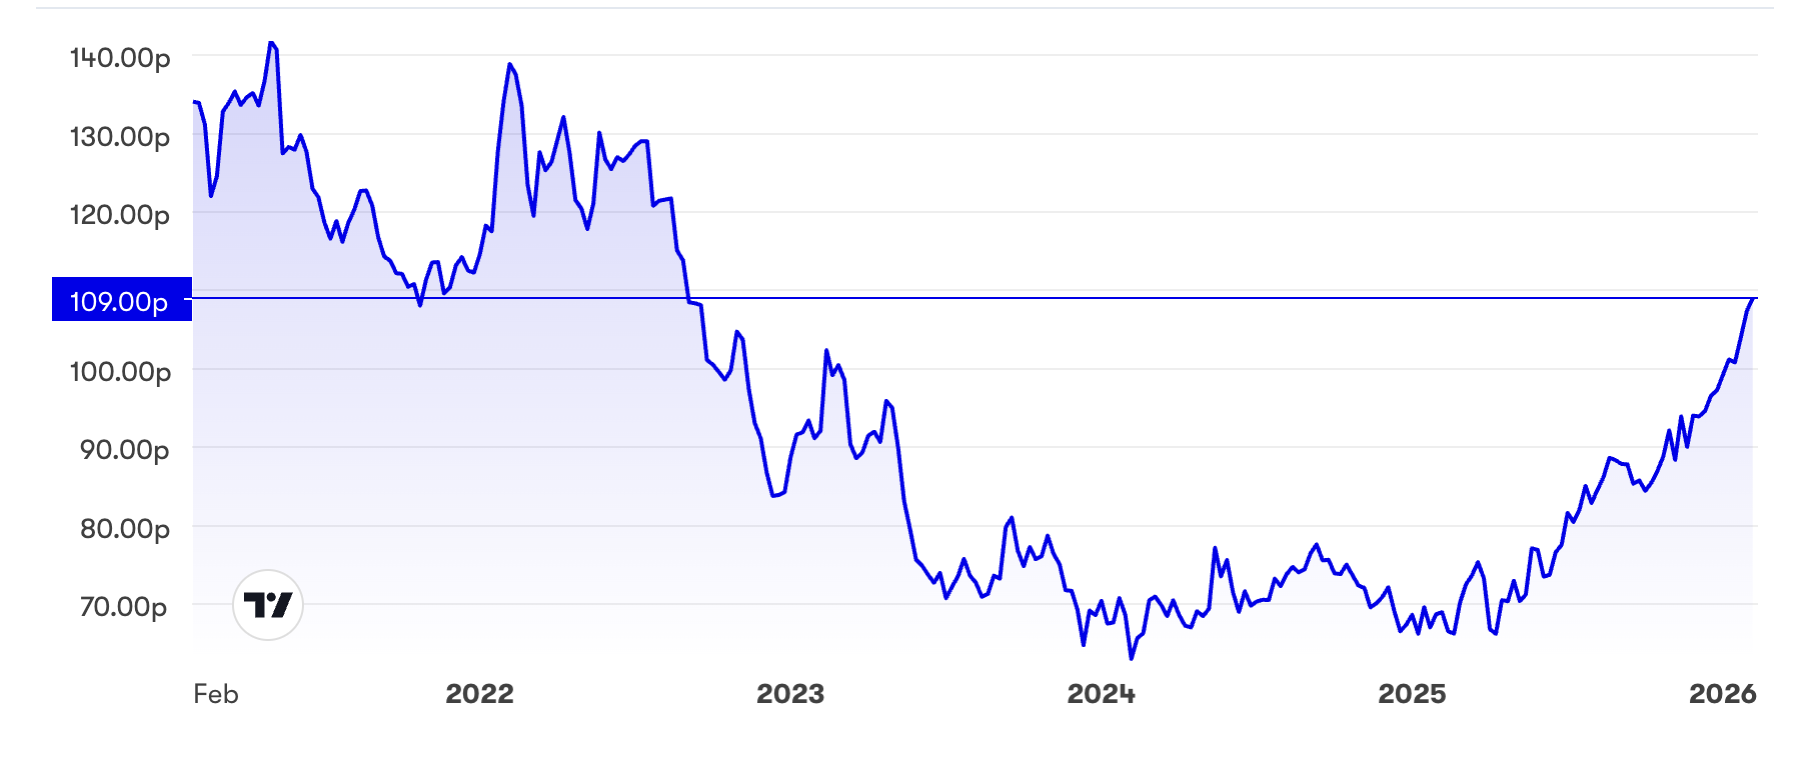
Source: interactive investor. Past performance is not a guide to future performance.
PE has broken out of single-figure, pariah status
With consensus for €2.1 billion (£1.8 billion) net profit in the current year to 31 March, rising near €2.3 billion in 2027, implied sterling earnings per share (EPS) would be 7.6p rising to 8.5p, hence this implies a forward price/earnings (PE) of 14.5x, easing to 13x with the shares currently 110p.
At the 65p low, it implied an 8.6x, 12 months’ forward PE and also a 7.5% prospective yield despite a 50% debasing in the dividend as more appropriate, in respect of the March 2025 year. A consensus 3.9p per share, as yet both for 2026 and 2027, should be covered 1.8x and 2.0 times respectively by earnings.
The prospective yield is now 4.5%, twice covered by earnings and much more so by Vodafone’s strong cash-flow profile (see table).
With underlying earnings growth around 13% in the coming financial year, it implies a price/earnings to growth ratio (PEG) below 1.0, which suggests value, albeit it is a snapshot view.
In hindsight, one can see justification for the rally, but does it add up to at least a “hold”, or has Vodafone become another popular momentum play exposed to fall, say, if the US/Iran conflict turns hot in the days or weeks ahead?
Vodafone - financial summary
year end 31 Mar
| 2016 | 2017 | 2018 | 2019 | 2020 | 2021 | 2022 | 2023 | 2024 | 2025 | |
| Revenue (€ million) | 49,810 | 47,631 | 46,571 | 43,666 | 44,974 | 43,809 | 37,010 | 37,672 | 36,717 | 37,448 |
| Operating margin (%) | 2.7 | 7.8 | 9.2 | -2.2 | 9.1 | 11.7 | 15.5 | 38.4 | 10.0 | -0.4 |
| Operating profit (€m) | 1,320 | 3,725 | 4,299 | -951 | 4,099 | 5,129 | 5,740 | 14,451 | 3,665 | -158 |
| Net profit (€m) | -5,405 | -6,297 | 2,439 | -8,020 | -920 | 59.0 | 2,237 | 11,838 | 1,140 | -4,169 |
| Reported EPS (euro cents) | -20.3 | -7.8 | 15.8 | -16.2 | -3.1 | 0.2 | 7.1 | 43.5 | 4.4 | -16 |
| Normalised EPS (cents) | -18.0 | -9.8 | 16.3 | -6.7 | -7.9 | 2.6 | 7.8 | 13.3 | 6.8 | -3 |
| Ops cashflow/share (cents) | 53.7 | 50.8 | 48.8 | 47.0 | 59.1 | 58.0 | 62.1 | 65.0 | 61.0 | 58.8 |
| Capex/share (cents) | 52.0 | 31.7 | 29.3 | 29.5 | 25.8 | 29.1 | 31.1 | 33.2 | 25.3 | 25.6 |
| Free cashflow/share (cents) | 1.7 | 19.2 | 19.5 | 17.5 | 33.2 | 28.9 | 31.0 | 31.8 | 35.7 | 33.2 |
| Dividend/share (cents) | 14.4 | 14.8 | 15.1 | 9.2 | 8.9 | 9.2 | 9.0 | 9.0 | 9.0 | 4.6 |
| Earnings cover (x) | -1.4 | -0.5 | 1.1 | -1.8 | -0.4 | 0.0 | 0.8 | 4.8 | 0.5 | -3.5 |
| Return on capital (%) | 1.0 | 3.3 | 4.0 | -0.8 | 3.0 | 4.1 | 4.8 | 11.9 | 3.0 | -0.1 |
| Cash (€m) | 18,259 | 14,955 | 13,469 | 26,649 | 20,646 | 14,980 | 15,427 | 18,722 | 11,275 | 18,425 |
| Net debt (€m) | 38,793 | 31,314 | 29,512 | 26,306 | 54,279 | 52,780 | 54,665 | 47,668 | 45,712 | 34,718 |
| Net asset value (€m) | 83,325 | 72,200 | 67,640 | 62,218 | 61,410 | 55,804 | 54,783 | 63,399 | 59,966 | 52,745 |
| Net asset value/share (cents) | 314 | 271 | 254 | 228 | 229 | 198 | 193 | 235 | 221 | 211 |
Source: historic Company REFS and company accounts.
A recent narrative of profit and cash flow ‘at the upper end of guidance’
This latest update maintains a theme since last November’s interims to 30 September. Notice how profit means adjusted EBITDA, albeit backed by cash and with consensus anticipating full-year March 2026 adjusted net profit to show a strong turnaround.
First-half total revenue rose 7.3% and €2.2 billion interim operating profit implied a good 11.0% margin, albeit down on €2.4 billion in 2024 - as was net profit by a similar magnitude despite investment income nearly matching €1.1 billion financing costs. The temporary hitch affecting such profit was “merger/takeover activity including temporary non-cash accounting impacts of our Indian simplification activities” – as if one can rely on Vodafone to be complex – but should abate as the group streamlines.
Interim cash flow from operations fell 9.8% to €5.1 billion and net debt actually rose to €44.4 billion from €42.1 billion. Mixed financials were sweetened by strong revenue growth in Africa at 13.5%, while Germany remained mixed – if improving – and significant hopes were pinned on the integration of Three improving UK prospects.
- Stockwatch: an exciting share off the radar of most investors
- Is this lofty Lloyds Bank price target justified?
As if investors felt challenged what to make of all this, the shares initially jumped from 86p to 96p then fell 90p, but steadily improved with the index to breach 100p in early January.
We are now told of 6.5% revenue growth in October to December, with strong service revenue growth partially offset by foreign exchange movements; albeit driven by Africa and Turkey. While India was again blamed for impacting reported profit, group adjusted EBITDA rose 5.3% organically.
In key financial terms it thus remains a quite messy narrative, but when I twice rated Vodafone “buy” from 68p in 2024 it was in a sense that a multi-year rationalisation programme could steadily yield results after investment in fibre and 5G networks.
I was particularly struck by the then CFO buying over £1.7 million shares at 69.6p – only for the price to fall to 67p – as if implicitly he sensed there was a longer-term financial prize, given Vodafone’s trajectory.
So, despite Germany and the UK as yet soft for sales growth, perhaps this profit and cash-flow guidance is a silver lining on mixed clouds.
€8bn sale of Vodafone Italy to Swisscom has helped overall
This prospect was another key plank for a “buy” case below 70p. The deal, which completed a year ago, and looked able to support both dividends and buybacks while also cutting debt, hence an aspect of financial de-risking.
The 30 September balance sheet showed longer-term debt having reduced from €46.1 billion to €44.2 billion, although finance costs still rose from £0.8 billion to €1.1 billion, offset by higher investment income.
There was no update on net gearing yesterday but it was around 66% last September based on €35 billion net debt that peaked at €55 billion at the end of March 2022.
In this respect I would have preferred to see it having been cut further than engage a €4 billion share buyback programme over the last two years.
Yet the disclosed short position (over 0.5% of issued share capital) having essentially unwound from 4.5% over 2021, implies that Vodafone’s debt is manageable. The Canada Pension Plan Investment Board, the sole disclosed shorter left, which manifested last December, is 0.90% short although I have seen this institution have shorts work against it. Marshall Wace, which I respect, reduced its short last June.
Germany looks the key market to determine further upside
The latest update shows the country constituting 32% of group revenue, with 0.7% year-on-year growth in services – not even matching inflation but at least returning to nominal growth.
Back in 2024, Germany was trending down over 6%, with the rest of Europe around 3%. There was, however, an exceptional factor of rule-changing where cable TV sold into apartments was often bundled into rental packages, leaving tenants with no choice. Once liberated, some tenants left but this shift ought now to have worked through.
- Are high fees chipping away at your investment returns?
- Sign up to our free newsletter for investment ideas, latest news and award-winning analysis
Unfortunately, the German market is still overall below expectations, helping explain the shares’ initial drop in response to the update.
Two non-executive directors bought nearly £20K and £50K worth of shares
These were struck at 95p and 94p respectively, mid last November, although they did promptly follow the human resources, executive director, selling £287,000 worth at 95.6p.
The CEO also sold £756,000 worth at 86.8p last August, after £88,500 worth at 83p earlier in the month.
Given that these executive’ trades are shown to have ceded upside and may be part of the modern culture where option grants fairly swiftly maintain equity exposure, objectively I put more emphasis on the non-executives’ buying. However, I dislike the way executives and shareholders face risk/reward differently.
Remains a patient play on German recovery and debt reduction
At 110p, I think the market will want to see better traction in Germany to move on from the current “good in parts” updates, hence I would be cautious at asserting “buy” now that the PE and yield are broadly appropriate – at least in the short to medium term.
While net asset value is around 190p per share, remember that around 64% is constituted by goodwill/intangibles, but that still reassures with a 10% discount to the share price on a tangible basis. “Hold.”
Edmond Jackson is a freelance contributor and not a direct employee of interactive investor.
These articles are provided for information purposes only. Occasionally, an opinion about whether to buy or sell a specific investment may be provided by third parties. The content is not intended to be a personal recommendation to buy or sell any financial instrument or product, or to adopt any investment strategy as it is not provided based on an assessment of your investing knowledge and experience, your financial situation or your investment objectives. The value of your investments, and the income derived from them, may go down as well as up. You may not get back all the money that you invest. The investments referred to in this article may not be suitable for all investors, and if in doubt, an investor should seek advice from a qualified investment adviser.
Full performance can be found on the company or index summary page on the interactive investor website. Simply click on the company's or index name highlighted in the article.
Disclosure
We use a combination of fundamental and technical analysis in forming our view as to the valuation and prospects of an investment. Where relevant we have set out those particular matters we think are important in the above article, but further detail can be found here.
Please note that our article on this investment should not be considered to be a regular publication.
Details of all recommendations issued by ii during the previous 12-month period can be found here.
ii adheres to a strict code of conduct. Contributors may hold shares or have other interests in companies included in these portfolios, which could create a conflict of interests. Contributors intending to write about any financial instruments in which they have an interest are required to disclose such interest to ii and in the article itself. ii will at all times consider whether such interest impairs the objectivity of the recommendation.
In addition, individuals involved in the production of investment articles are subject to a personal account dealing restriction, which prevents them from placing a transaction in the specified instrument(s) for a period before and for five working days after such publication. This is to avoid personal interests conflicting with the interests of the recipients of those investment articles.