Thoughts on Barclays and bitcoin
Independent analyst Alistair Strang updates his chart forecasts for both the struggling cryptocurrency and the popular high street bank.
22nd June 2026 07:18
by Alistair Strang from Trends and Targets
Cryptoassets are very high risk and you should be prepared to lose all your money before you invest
The markets are proving a little crazy this year, perhaps even full-on fruitcake. From a UK perspective, share prices want to go up, some quite substantially. But Brent crude wants to drop quite sharply, gold often feels on the edge of a meltdown toward the $3,000 level, and cryptocurrency only has itself to blame.
- Invest with ii:Open a Stocks & Shares ISA | Top ISA Funds | Transfer your ISA to ii
Obviously, the Iran war has focussed minds on just what is and is not a safe place to store your currency, and crypto has been left wanting, pretty conclusively. In fact, should bitcoin manage to close a session below $63k, things risk becoming particularly nasty with a visit to the $50k level initially, with our secondary looking absurd around $25k and a return to the levels of three years ago.
Making things worse, bitcoin has enacted a pretty neat head & shoulders movement formation since the start of 2025. The guy who theorised this to be a useful charting weapon calculated around $38k would be a typical outcome in the current scenario. Our expectation of around $25k is rather more painful, a result we anticipate to prove correct.
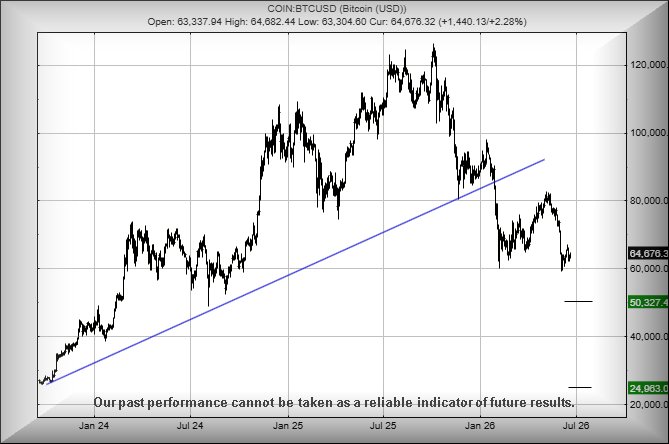
Source: Trends and Targets. Past performance is not a guide to future performance. Important: Trends and Targets charts only incorporate official share count consolidations, ignoring rights issues where investors have a choice as to whether to participate.
As for Barclays (LSE:BARC), its share price is doing fairly similar things to others in the banking sector. Essentially, there appears to be quite a lot of confidence (mostly hidden) which should flourish once the Iran shambles is complete.
In the last few days, Barclays' share price took a glance above the Blue downtrend since 2007, didn’t like what it saw and promptly retreated to the comparative safety below Blue. Generally, this sort of nonsense defines a share which, if it is going to move, will move fast. All it needs do is actually start going up!
Above 508p should provide a sane trigger to suggest proper movement is coming, this giving the threat of a visit to an initial 528p with our secondary for the longer term calculating at a less likely 614p.
If things intend to go wrong for Barclays, their share price needs to shuffle below Red at 460p currently, risking a visit down to an initial 448p. There is certainly hope for a near-term bounce at such a level but our secondary, if it breaks, works out at a future 428p and the risk of the price getting stuck in the mud for a while.
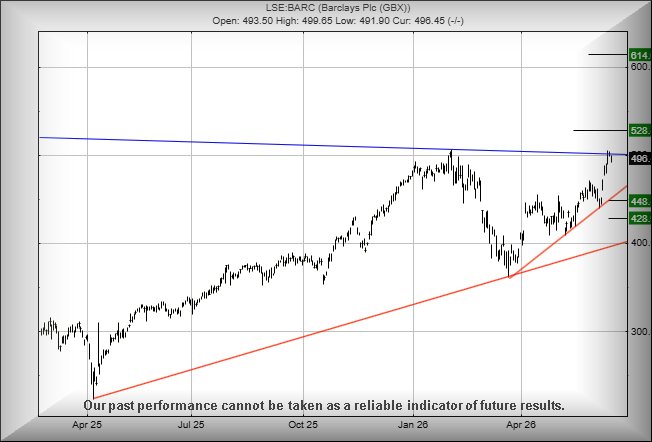
Source: Trends and Targets. Past performance is not a guide to future performance. Important: Trends and Targets charts only incorporate official share count consolidations, ignoring rights issues where investors have a choice as to whether to participate.
Alistair Strang has led high-profile and "top secret" software projects since the late 1970s and won the original John Logie Baird Award for inventors and innovators. After the financial crash, he wanted to know "how it worked" with a view to mimicking existing trading formulas and predicting what was coming next. His results speak for themselves as he continually refines the methodology.
Alistair Strang is a freelance contributor and not a direct employee of Interactive Investor. All correspondence is with Alistair Strang, who for these purposes is deemed a third-party supplier. Buying, selling and investing in shares is not without risk. Market and company movement will affect your performance and you may get back less than you invest. Neither Alistair Strang or Interactive Investor will be responsible for any losses that may be incurred as a result of following a trading idea.
These articles are provided for information purposes only. Occasionally, an opinion about whether to buy or sell a specific investment may be provided by third parties. The content is not intended to be a personal recommendation to buy or sell any financial instrument or product, or to adopt any investment strategy as it is not provided based on an assessment of your investing knowledge and experience, your financial situation or your investment objectives. The value of your investments, and the income derived from them, may go down as well as up. You may not get back all the money that you invest. The investments referred to in this article may not be suitable for all investors, and if in doubt, an investor should seek advice from a qualified investment adviser.
Full performance can be found on the company or index summary page on the interactive investor website. Simply click on the company's or index name highlighted in the article.