Trusts at a discount which could outperform the rest
The listed private equity sector has seen discounts widen markedly, but does this present an opportunity?
5th June 2020 15:55
This content is provided by Kepler Trust Intelligence, an investment trust focused website for private and professional investors. Kepler Trust Intelligence is a third-party supplier and not part of interactive investor. It is provided for information only and does not constitute a personal recommendation.
Material produced by Kepler Trust Intelligence should be considered a marketing communication, and is not independent research.
The listed private equity sector has seen discounts widen markedly, but does this present an opportunity?

Price is what you pay, value is what you get
William Heathcoat Amory, Founder, Kepler Trust Intelligence.
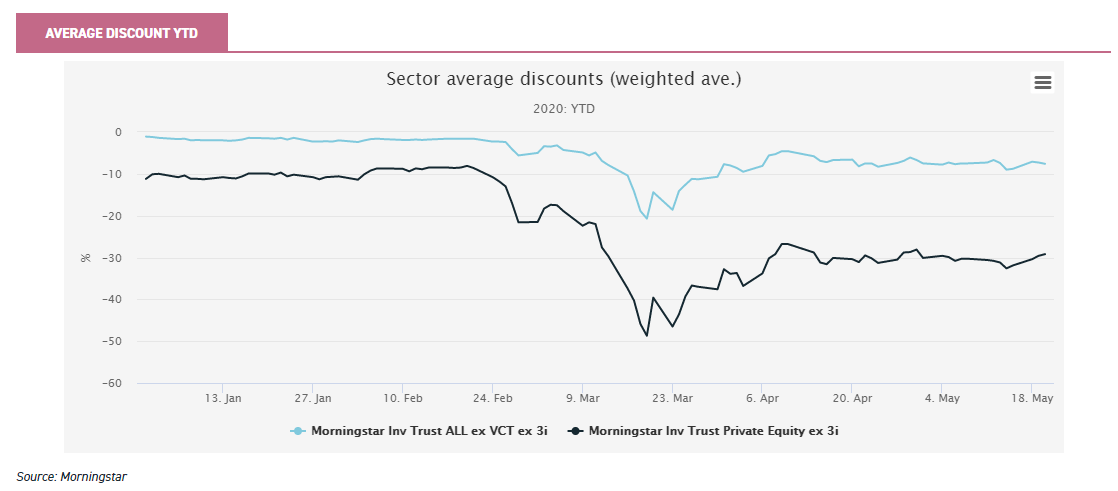
Discounts across the investment trust sector have widened - dramatically at first – but in most cases have now narrowed back in somewhat.
At first glance, the listed private equity (LPE) sector has widened most of all, and remains on a significantly bigger discount than other sectors. Does this present an opportunity?
Most companies and funds that are backed by private equity are revalued only periodically, using public market multiples as comparators.
Sometimes this occurs quarterly, but in our experience most underlying companies are only properly revalued semi-annually.
The falls in share prices experienced in February and March are therefore based on an expectation – rather than the reality – of NAV declines.
The ‘discounts’ illustrated in the graph above are therefore largely illusory. The reality of the discount implied by today’s share prices is likely to only emerge later.
Uncertainty on this point likely provides part of the explanation as to why discounts have blown out for LPE trusts across the board.
In our opinion, however, whether LPE trusts are on a discount of 10%, 20% or 30% (to what NAVs will eventually fall to) should be largely irrelevant to long-term investors.
As the past decade has shown, the chance of an extra ten percentage points of performance from the discount narrowing pales into insignificance when looking at the NAV outperformance of listed equity indices.
We believe it is the underlying businesses – and the way private equity managers create value – that actually offer real attraction for long-term investors in the asset class.
Discounts miss the point: underlying companies are the main attraction
Are the LPE sector’s discounts justified? Is now a buying opportunity? In our view, current discounts offset some of the immediate NAV downside potential. Rather than valuations being what Ben Graham (and more recently Seth Klarman) look for as a ‘margin of safety’, we believe it is the attractiveness of the underlying businesses that long-term investors should be focussing on.
Firstly, in terms of ‘stock picking’, private equity managers usually build up expertise in buying, building and then selling very specific types of businesses in small niches.
Over time it is relatively common for individuals within the team to have invested, grown and sold multiple businesses within the same sector or niche.
Obviously each investment they make is unique, but managers can gain a significant edge over others by repeating deals within the same niche, and further developing expertise as they go.
For example, Oakley Capital Investments (LSE:OCI) has developed niches in the consumer, education and TMT sectors. Within these areas they have a strong preference for buying businesses that are founder-led, and indeed they are typically the first ‘institutional’ investor in those companies.
Their investing activities have led to impressive NAV growth for the trust, with the last three and a half years proving particularly strong. Similarly for the last decade or so HgCapital has invested mainly in software and software related businesses, having originally had a much wider focus.
ICG Enterprise Trust (LSE:ICGT), on the other hand, is more highly diversified than either of these directly investing LPE trusts. It operates as a hybrid, investing both directly and in funds of funds.
When we caught up with the managers recently, they highlighted a few examples illustrating the defensiveness of many companies in their portfolio.
Both examples they provided were co-investments made by ICGT, alongside the private equity manager.
In both cases, the managers behind the investment had long experience in the respective sectors inhabited by their businesses; which helped give the ICG team confidence that each investment would likely prove resilient in any downturn and ultimately be successful.
Among the managers we speak to regularly, many of the lessons of the past crisis seem to have been heeded.
Perhaps as a result, we get the impression that many of the underlying businesses within listed private equity portfolios have been picked for their defensive characteristics; which perhaps puts these LPE trusts in a stronger position in a downturn than some of their quoted comparators in the same industry or sector.
At a higher level, this pattern can be illustrated by the relative lack of high street retail, financials, energy, and materials exposure found in LPE trust portfolios.
By comparison listed equity markets have very significant exposure to these sectors. We believe that the LPE sector is ‘overweight’ relative to listed equity indices in more defensive sectors such as technology, healthcare and consumer staples.
So, while they are generally positioned in less cyclical sectors, we believe that, at an operational level, private equity backed companies are also used to dealing with change. With private equity managers having total control, they are well set up to evaluate new circumstances and adapt, which helps enable continued growth.
Managers are not afraid to take hard short-term decisions, if that is in the long-term interests of a business. Importantly, by having control, they can take these decisions quickly.
In contrast to listed companies, which have to announce regular trading updates that can negatively affect the share price, managers can make investments and plan for the future away from the noise and distraction of the stock market.
Most private equity managers have investment horizons of three to five years minimum, whereas quoted equity funds often display a level of turnover which implies significantly shorter investment horizons. We all hear about the negative effects of the short-termism displayed by investors.
We discuss the structural advantages investment trusts give to long-term investors here. The public market’s short-termism must – inevitably – rub off on managers of many quoted companies; resulting in decisions where the short and long-term implications are potentially at odds.
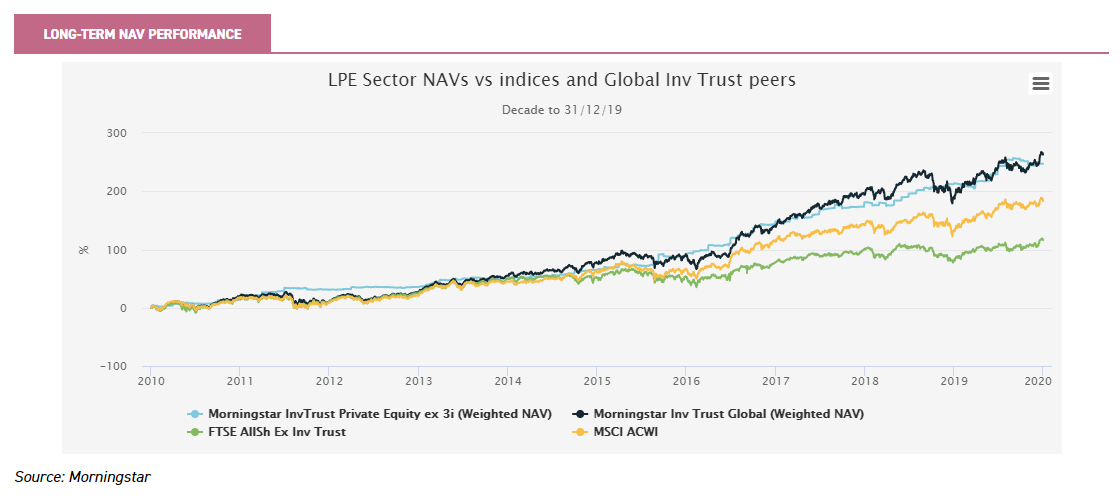
The long-term outperformance of wider equity indices by private equity trusts perhaps illustrates the benefits of this long-term thinking, as illustrated in the graph below.
It is worth noting that on a NAV basis (by weighted average, representing what the average investor has experienced) investors in LPE trusts will have performed as strongly as the Global Investment Trust peer group. This is notable given the incredibly strong performance of Scottish Mortgage (LSE:SMT) (another long-term thinker) and its dominant influence as (by far) the largest trust in this sector.
The depth of managerial talent is another key advantage that private equity backed businesses possess: which is of particular relevance when businesses are hit by a ‘black swan’ event such as the coronavirus lockdowns. It is usual for the managers of such businesses to have a deep pool of expertise, to help them guide their businesses away from the proverbial rocks in these kinds of events.
Added to this is the team of managers at the private equity fund that has backed the company. In our view, the depth of talent available to underlying companies is particularly relevant when comparing the talent available to equivalent size companies in quoted markets.
HgCapital recently provided a good example. We understand that all the chief executives of the businesses that the trust invests in currently participate in a weekly coronavirus conference call. This is a forum for exchanging information and practical advice on how to help businesses adapt and cope with the unique challenges they are all facing.
The fact that the businesses in question are largely European software businesses, within different niches, makes the call – and the ability to exchange information – particularly relevant.
By comparison the chief executives of many quoted companies – especially smaller ones – are likely to be feeling quite isolated by not being able to be in the office; or not having access to a deep bench of knowledgeable, inexpensive advice.
There is one final and perhaps, over the short term, very important factor to consider: that financing structures are now significantly more balanced in favour of equity owners than they were in the past. One of the side effects of a decade of ultra-low interest rates is that income seekers have been prepared to forego strict covenants attached to loans to private equity backed businesses.
We understand that, as a result, private equity backed businesses have fewer covenants now than they had in the global financial crisis (GFC), combined with significantly lower borrowing costs. For example, NB Private Equity Partners (LSE:NBPE) provided information which shows that, of their top 30 investments (representing 58% of the portfolio), 64% have ‘covenant lite’ loan terms.
This increased flexibility should not be ignored, given the long-term equity financing that private equity brings. Having few material triggers on debt means that equity investors are more likely to ride through temporary storms, such as the current one, with values intact.
Related to this, many LPE trusts have entered the coronavirus crisis in better financial shape than in 2008-9. For example as at the end of April, Oakley Capital Investments (LSE:OCI) had cash of c. £250 million on its books (c. 36% of NAV based on Numis estimates), having made several large sales of companies in its portfolio. While the trust also had outstanding commitments of £429 million, as at December 2019, this cash balance puts it in a strong position to capitalise on any opportunities that the managers find in the immediate aftermath of the slowdown.
Others have been defensively drawing down credit facilities, which gives them added flexibility and the ability to act quickly if required.
NBPE, for example, has drawn down part of its credit facility such that, at the end of April 2020, it had total liquidity of $205 million.
So – while it is among the most highly geared of the LPE trusts (we estimate net gearing of around 30% of NAV – NBPE’s cash pool gives the managers huge flexibility to support existing portfolio investments or to invest opportunistically.
In our opinion, the fact that Neuberger Berman is more in control of its investing activities than its peers (NBPE makes only co-investments, which are done on an ad hoc basis) means that it is not necessarily more risky than other trusts, despite the higher gearing.
But what are discounts currently?
There has been plenty of speculation in the analyst and commentator community as to how valuations will evolve to reflect the coronavirus-induced economic slowdown; and therefore what ‘real’ discounts these shares are currently trading at.
It is likely that valuations as at 31 March 2020 – when released – will only be part of the story, and that the 30 June valuations will likely be more reflective of the true nature of things. Typically private equity funds provide full revaluations at the end of June and December annually.
Between these official revaluations they adjust for currency movements, realisation activity and movements in any quoted companies in the portfolio.
By the time the end-June 2020 valuations are completed, it seems likely we will know a lot more about the true impact of the slowdown on businesses and the economy.
This means that, in our view, it is the end- June NAVs (published from mid to late July onwards) that will be of most interest to followers of the LPE sector.
In the immediate short term, several sources have reported estimates or actual valuation changes for 31 March 2020, which might also serve as a reference point. Schroder Adveq, the private market investment arm of Schroders, published an interesting article which draws together their team’s thoughts on the implications of the crisis for private equity.
In summary they think valuations by sector will vary significantly (as has been the case in public markets). They expect an element of smoothing, but also expect the largest PE deals to be valued downwards more aggressively – thanks to higher leverage and the importance of near-term earnings for valuations.
In contrast they believe that early stage and venture investments will be marked down by less.
JPMorgan Cazenove take a more quantitative approach: comparing geographic and sector equity index movements, and applying them to LPE trust exposures to arrive at a comparable valuation decline for each trust’s portfolio.
They then take into account any gearing and expected defensiveness of the portfolio (beta), to arrive at a range of estimated NAV valuation movements across the sector of between -6.6% and -15.6% (excepting the outliers of Electra and JZ Capital, which are in wind-up).
Other private equity comparables which have already reported write-downs include KKR, the listed US private equity house. KKR reported that – as at Q1 2020 – its PE portfolios as a whole were marked down by 12% overall.
By comparison, Apollo Global marked its PE portfolios down by 21.6% over Q1; according to the company this was driven by “markdowns across public and private portfolio company holdings, including some impact from our energy holdings”. Interestingly, value player AVI Global (LSE:AGT) has recently initiated an investment in KKR, more details of which can be found here.
The above figures suggest it is likely that falls in listed private equity NAVs may be less dramatic than those experienced by equity indices: we shall find out soon enough. By 31 March UK equity markets had fallen by 34% year to date (FTSE All Share), underperforming European markets (MSCI Europe ex UK) which fell by 17.3% in sterling terms and the S&P 500 which fell 14.1% in sterling terms. If the estimates above come to pass, this would represent short-term outperformance by LPE trusts.
From those that have so far reported, the NAV outperformance of LPE over listed equities seems to be real and tangible, although share prices clearly lagged.
Looking at past history, this chimes with what happened during the GFC on a NAV basis; although share prices fell even more precipitously than this time around. At the same time it is worth noting that valuation falls in 2008 and 2009 took some time to be recognised by managers, as is illustrated in the graph below.

Valuation conventions have tightened up somewhat since the GFC. In our view this means that the industry will perhaps be more timely in recognising valuation movements in 2020, and that valuation committees (which sign off valuations for each fund) will decide to ‘take the medicine early’.
The International Private Equity and Venture Capital Valuation Guidelines (provided by IPEV) have issued special guidance on estimating ‘fair value’ as at 31/03/2020, which can be found here. In summary, IPEV observe that fair value does not equal a ‘fire sale’ price and should be based on what is known and knowable at the measurement date: hence why we think end-June valuations will be much more interesting than end-March.
The crux of the advice is that “care should be taken not to ‘double-dip’ with respect to valuation inputs”. The IPEV is making the observation that comparable public market valuation multiples have come down significantly, because earnings estimates of the future have not necessarily come down, or are at least unknowable. If private equity valuations do reflect significantly lower earnings expectations, then multiples do not necessarily have to fall as far as public market comparables.
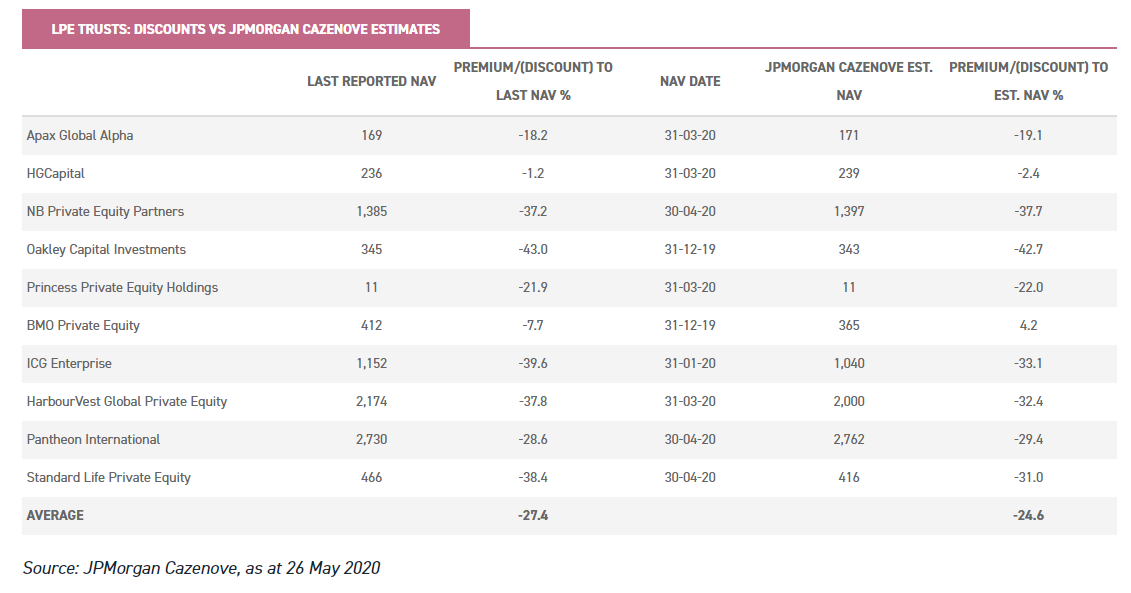
By using JPMorgan Cazenove’s estimates of NAVs, we can see headline discounts of the LPE sector (excluding those in wind-up) against the most recently announced NAVs. Even when the 31/03/2020 NAV has been reported, in many cases, JPM Cazenove believe that a lower NAV is valid because, in many cases, only a small proportion of each respective portfolio will have been changed from 31/12/2019.
The average discount for the sector (as at 26/05/2020) is therefore c. 25% on the basis of their calculations. This figure represents a significant widening of discounts from those seen in the first two months of the year, when average discounts were around 10%.
This is not the end of the story, however, given that – as we state above – 30 June 2020 valuations (expected from mid-July onwards) should be much more meaningful. If share prices stay at their current levels, it is fair to expect that discounts will narrow yet further thanks to the decline in ‘official’ NAVs.
Conclusion
In our view it should be largely irrelevant to long-term investors whether LPE trusts are on a discount of 10%, 20% or 30% (versus the level that NAVs will eventually fall to).
Clearly accessing any investment on a discount is desirable, if there is a decent prospect of it narrowing.
However, as the past decade has shown, the chance of an extra ten percentage points of performance from the discount narrowing pales into insignificance, when looking at the NAV outperformance of listed equity indices.
From our perspective there are solid fundamental reasons for this outperformance over time. There are certainly potential pitfalls on the horizon: underlying companies tend to be more highly geared than equivalent listed businesses and, with few realisations likely on the horizon, investors need to be aware of each company’s commitment cover.
There are also no guarantees that discounts will narrow, and could even widen yet further.
The lessons of the GFC appear to have been learned, however. Managers are entering this crisis in a significantly better position financially than in 2008.
Additionally, the characteristics of the underlying portfolios and the depth of talent available to guide them through the economic slowdown – in our view – mean they are well placed to perform more strongly than equivalent listed businesses.
Private equity investing is a repeatable process, with the best managers able to drive value generation through active ownership.
These managers have done so for many years in the past, and there is no reason to suggest that they will not do so in the future.
For long-term investors, discounts offer an attractive entry point to access fundamentally solid long-term business opportunities.
In our opinion, the underlying portfolios suggest that it is a sector that definitively deserves more attention.
Kepler Partners is a third-party supplier and not part of interactive investor. Neither Kepler Partners or interactive investor will be responsible for any losses that may be incurred as a result of a trading idea.
Full performance can be found on the company or index summary page on the interactive investor website. Simply click on the company's or index name highlighted in the article.
Important Information
Kepler Partners is not authorised to make recommendations to Retail Clients. This report is based on factual information only, and is solely for information purposes only and any views contained in it must not be construed as investment or tax advice or a recommendation to buy, sell or take any action in relation to any investment.
This report has been issued by Kepler Partners LLP solely for information purposes only and the views contained in it must not be construed as investment or tax advice or a recommendation to buy, sell or take any action in relation to any investment. If you are unclear about any of the information on this website or its suitability for you, please contact your financial or tax adviser, or an independent financial or tax adviser before making any investment or financial decisions.
The information provided on this website is not intended for distribution to, or use by, any person or entity in any jurisdiction or country where such distribution or use would be contrary to law or regulation or which would subject Kepler Partners LLP to any registration requirement within such jurisdiction or country. Persons who access this information are required to inform themselves and to comply with any such restrictions. In particular, this website is exclusively for non-US Persons. The information in this website is not for distribution to and does not constitute an offer to sell or the solicitation of any offer to buy any securities in the United States of America to or for the benefit of US Persons.
This is a marketing document, should be considered non-independent research and is subject to the rules in COBS 12.3 relating to such research. It has not been prepared in accordance with legal requirements designed to promote the independence of investment research.
No representation or warranty, express or implied, is given by any person as to the accuracy or completeness of the information and no responsibility or liability is accepted for the accuracy or sufficiency of any of the information, for any errors, omissions or misstatements, negligent or otherwise. Any views and opinions, whilst given in good faith, are subject to change without notice.
This is not an official confirmation of terms and is not to be taken as advice to take any action in relation to any investment mentioned herein. Any prices or quotations contained herein are indicative only.
Kepler Partners LLP (including its partners, employees and representatives) or a connected person may have positions in or options on the securities detailed in this report, and may buy, sell or offer to purchase or sell such securities from time to time, but will at all times be subject to restrictions imposed by the firm's internal rules. A copy of the firm's conflict of interest policy is available on request.
Past performance is not necessarily a guide to the future. The value of investments can fall as well as rise and you may get back less than you invested when you decide to sell your investments. It is strongly recommended that Independent financial advice should be taken before entering into any financial transaction.
PLEASE SEE ALSO OUR TERMS AND CONDITIONS
Kepler Partners LLP is a limited liability partnership registered in England and Wales at 9/10 Savile Row, London W1S 3PF with registered number OC334771.
Kepler Partners LLP is authorised and regulated by the Financial Conduct Authority.
Kepler Partners is a third-party supplier and not part of interactive investor. Neither Kepler Partners or interactive investor will be responsible for any losses that may be incurred as a result of a trading idea.
These articles are provided for information purposes only. Occasionally, an opinion about whether to buy or sell a specific investment may be provided by third parties. The content is not intended to be a personal recommendation to buy or sell any financial instrument or product, or to adopt any investment strategy as it is not provided based on an assessment of your investing knowledge and experience, your financial situation or your investment objectives. The value of your investments, and the income derived from them, may go down as well as up. You may not get back all the money that you invest. The investments referred to in this article may not be suitable for all investors, and if in doubt, an investor should seek advice from a qualified investment adviser.
Full performance can be found on the company or index summary page on the interactive investor website. Simply click on the company's or index name highlighted in the article.
Important Information
Kepler Partners is not authorised to make recommendations to Retail Clients. This report is based on factual information only, and is solely for information purposes only and any views contained in it must not be construed as investment or tax advice or a recommendation to buy, sell or take any action in relation to any investment.
This report has been issued by Kepler Partners LLP solely for information purposes only and the views contained in it must not be construed as investment or tax advice or a recommendation to buy, sell or take any action in relation to any investment. If you are unclear about any of the information on this website or its suitability for you, please contact your financial or tax adviser, or an independent financial or tax adviser before making any investment or financial decisions.
The information provided on this website is not intended for distribution to, or use by, any person or entity in any jurisdiction or country where such distribution or use would be contrary to law or regulation or which would subject Kepler Partners LLP to any registration requirement within such jurisdiction or country. Persons who access this information are required to inform themselves and to comply with any such restrictions. In particular, this website is exclusively for non-US Persons. The information in this website is not for distribution to and does not constitute an offer to sell or the solicitation of any offer to buy any securities in the United States of America to or for the benefit of US Persons.
This is a marketing document, should be considered non-independent research and is subject to the rules in COBS 12.3 relating to such research. It has not been prepared in accordance with legal requirements designed to promote the independence of investment research.
No representation or warranty, express or implied, is given by any person as to the accuracy or completeness of the information and no responsibility or liability is accepted for the accuracy or sufficiency of any of the information, for any errors, omissions or misstatements, negligent or otherwise. Any views and opinions, whilst given in good faith, are subject to change without notice.
This is not an official confirmation of terms and is not to be taken as advice to take any action in relation to any investment mentioned herein. Any prices or quotations contained herein are indicative only.
Kepler Partners LLP (including its partners, employees and representatives) or a connected person may have positions in or options on the securities detailed in this report, and may buy, sell or offer to purchase or sell such securities from time to time, but will at all times be subject to restrictions imposed by the firm's internal rules. A copy of the firm's conflict of interest policy is available on request.
Past performance is not necessarily a guide to the future. The value of investments can fall as well as rise and you may get back less than you invested when you decide to sell your investments. It is strongly recommended that Independent financial advice should be taken before entering into any financial transaction.
PLEASE SEE ALSO OUR TERMS AND CONDITIONS
Kepler Partners LLP is a limited liability partnership registered in England and Wales at 9/10 Savile Row, London W1S 3PF with registered number OC334771.
Kepler Partners LLP is authorised and regulated by the Financial Conduct Authority.
These articles are provided for information purposes only. Occasionally, an opinion about whether to buy or sell a specific investment may be provided by third parties. The content is not intended to be a personal recommendation to buy or sell any financial instrument or product, or to adopt any investment strategy as it is not provided based on an assessment of your investing knowledge and experience, your financial situation or your investment objectives. The value of your investments, and the income derived from them, may go down as well as up. You may not get back all the money that you invest. The investments referred to in this article may not be suitable for all investors, and if in doubt, an investor should seek advice from a qualified investment adviser.
Full performance can be found on the company or index summary page on the interactive investor website. Simply click on the company's or index name highlighted in the article.