Vodafone: something curious is going on with this share price
Our columnist is – almost – at a loss about what the stock might do next.
27th May 2021 08:40
by Alistair Strang from Trends and Targets
Our columnist is – almost – at a loss about what the stock might do next.
Vodafone Group
There's something extremely curious going on with the stock market and the share price of Vodafone Group (LSE:VOD).
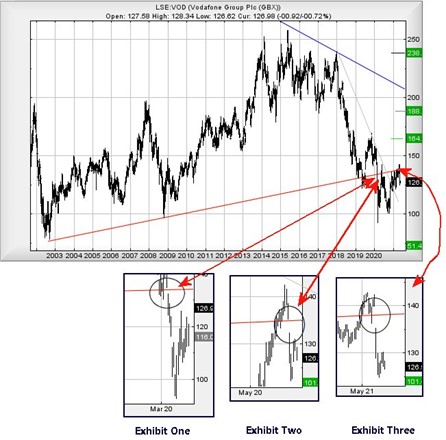
In fact, we've never seen this sort of thing before. Vodafone continues to frustrate, due to its lack of realistic movements. For instance, the drop last year to 93p was, from our perspective, arithmetically correct, reaching a calculated target and going no further. In the period since, briefly achieving 140p wasn't the most exciting interaction with its long-term red uptrend.
This uptrend makes us question what the heck the market is playing at with Vodafone. We've shown three zoomed-in areas where we question some price movements. It's worth remembering the red line dates back to 2002, clearly something the stock market attaches a lot of importance to.
Exhibit one: In March 2020, the market gapped the price below the historical red uptrend. Not a big deal, we thought. Just a Covid-19 thing.
Exhibit two: In June 2020, Vodafone looked like it was enacting recovery. The market said "nope", promptly gapping the share price down below the historical red uptrend.
Exhibit three: In May 2021, Vodafone yet again looked like it was trying for recovery. The market again said "nope", gapping the share price safely below the uptrend.
- ii view: is bad reaction to Vodafone results justified?
- Vodafone confirms massive IPO and big dividend
- Why reading charts can help you become a better investor
While a chart pattern clearly hasn't formed, a pattern of behaviour surely makes itself clear. In the period to which we refer, the FTSE 100 has struggled to recover.
At times we've felt the market itself was the enemy, determined for the FTSE 100 to founder while European and American markets flourished. It remains a surprise how the UK AIM market, for years the whipping boy amongst UK indices, essentially is matching US price strengths, while the FTSE 100 does its own thing.
As gaps are, essentially, share price manipulation, it begs the question as to what's going on? Surely if this deliberate restraint continues some of the market grown-ups must start asking questions?
We're almost at a loss regarding Vodafone’s current prospects. With every attempt at recovery being reversed by ‘trading gaps’, we can only suspect Vodafone needs to be gapped up above red to indicate a change of heart, along with a strong suggestion pointing at sustained recovery.
At present, if Vodafone exceeded 140p we'd be fairly certain movement in the direction of 164p was ahead. If exceeded, our secondary calculates at a longer-term 188p and, importantly, moves the share price into pole position for challenging price levels not seen since 2016.
Thanks to the repeated gapping behaviour, we'd now experience considerable alarm if the market ever discovered an excuse to move Vodafone below 93p. Such treacherous territory allows for an ultimate bottom of 51p.
Source: Trends and Targets. Past performance is not a guide to future performance
Alistair Strang has led high-profile and "top secret" software projects since the late 1970s and won the original John Logie Baird Award for inventors and innovators. After the financial crash, he wanted to know "how it worked" with a view to mimicking existing trading formulas and predicting what was coming next. His results speak for themselves as he continually refines the methodology.
Alistair Strang is a freelance contributor and not a direct employee of Interactive Investor. All correspondence is with Alistair Strang, who for these purposes is deemed a third-party supplier. Buying, selling and investing in shares is not without risk. Market and company movement will affect your performance and you may get back less than you invest. Neither Alistair Strang or Interactive Investor will be responsible for any losses that may be incurred as a result of following a trading idea.
These articles are provided for information purposes only. Occasionally, an opinion about whether to buy or sell a specific investment may be provided by third parties. The content is not intended to be a personal recommendation to buy or sell any financial instrument or product, or to adopt any investment strategy as it is not provided based on an assessment of your investing knowledge and experience, your financial situation or your investment objectives. The value of your investments, and the income derived from them, may go down as well as up. You may not get back all the money that you invest. The investments referred to in this article may not be suitable for all investors, and if in doubt, an investor should seek advice from a qualified investment adviser.
Full performance can be found on the company or index summary page on the interactive investor website. Simply click on the company's or index name highlighted in the article.