What we are doing as markets fall
20th June 2022 14:36
by Douglas Chadwick from ii contributor
With more than 90% of funds down in the past seven days, Saltydog is selling and has most of its money in cash.
This content is provided by Saltydog Investor. It is a third-party supplier and not part of interactive investor. It is provided for information only and does not constitute a personal recommendation.
The war in Ukraine drags on and there's no sign of it ending. No one is “winning”, and the number of people killed or injured, on both sides, continues to rise. Sanctions by the West on Russia, designed to cripple its economy, will have knock-on effects around the world. This is pushing up commodity prices, which were already rising before the war.
Global growth forecasts have been cut by the Organisation for Economic Co-operation and Development (OECD) and the International Monetary Fund (IMF). In the UK, we are facing a cost-of-living crisis. Inflation is the highest it has been for decades, and according to the British Chambers of Commerce, UK economic growth will “grind to a halt” this year and then may briefly go into reverse.
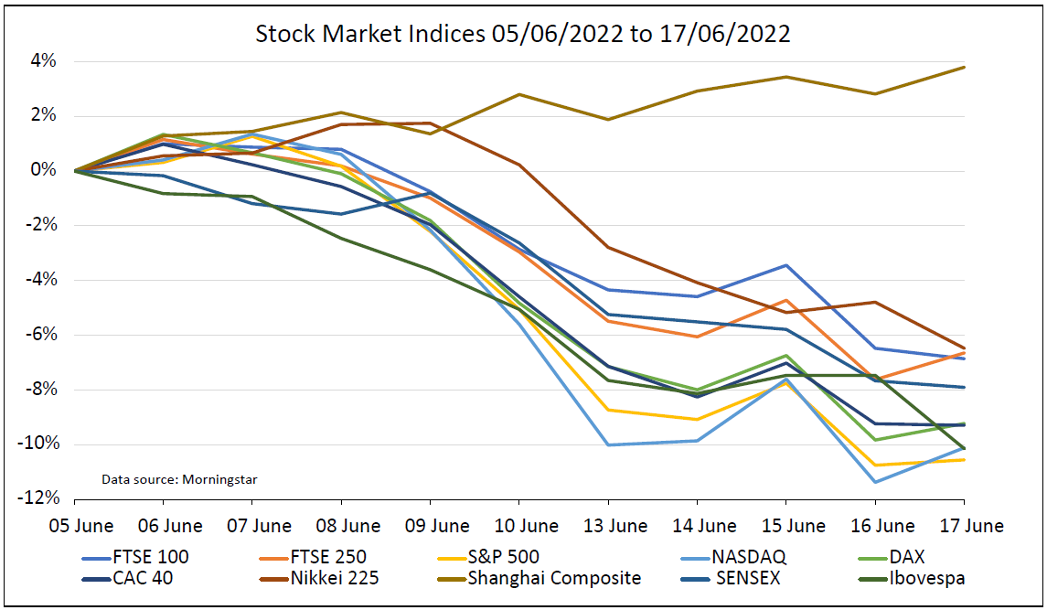
Between 5 June and the end of last week, the S&P 500, probably the most influential stock market index in the world, fell by 10.6%. The UK’s FTSE 100 was down 6.9% and the FTSE 250 lost 6.6%. In Europe, the French CAC 40 and German DAX were down more than 9%. The Japanese Nikkei 225, Indian Sensex, and the Brazilian Ibovespa were also down. The Shanghai Composite bucked the trend, gaining 3.8%.
Past performance is not a guide to future performance.
Every week, we review the performance of the most readily available retail funds (unit trusts and OEICs).
Because they are not traded on a stock exchange, the only way to establish their price is by asking the fund managers. Most funds are valued once a day, and usually at midday. However, some fund managers use a different time, and a few funds are valued only once a week. There are just a few companies that collate all the price data, and we use Morningstar.
Some fund managers are better than others when it comes to reporting their price information and we have found that if we look on a Monday, there are still quite a few funds that have not reported their price from the previous Friday. That is why we wait until Tuesday afternoon before downloading the raw data. We process it late on Tuesday ready for release on Wednesday, which is when we review our demonstration portfolios and decide if we want to make any changes.
When we looked at the numbers on Wednesday 8 June, things were not looking too bad. Our latest sector analysis was showing most sectors making gains in the previous week. The few that struggled were the ones investing in bonds and gilts (UK government bonds).
The best-performing sectors were the combined Asia-Pacific sector, up by 2.6%, Global Emerging Markets, and Technology & Technology Innovations, which both went up by 2.7%, and China/Greater China which made 4.8%. Both of our demonstration portfolios had risen since the previous Wednesday.
You can see from the graph above, that from 8 June onwards, most stock markets fell significantly.
The main thing weighing on investors’ minds was the increasing likelihood that we might be heading for a global recession. Investors were wondering what action the central banks, and the Federal Reserve in particular, were going to take. The Federal Open Market Committee (FOMC) was due to meet on the 14/15 June and everyone thought that they would be raising interest rates again, the question was, by how much?
The consensus had recently shifted from 0.5 percentage points to 0.75, sparking a sell-off in equity markets around the world.
When we looked at our reports last Wednesday, they were pretty dire; nearly all sectors had gone down in the previous week. Both our portfolios were also down, in fact all our holdings had gone down since the previous Wednesday. Believe it or not, 94% of the funds we track had gone down in the previous seven days.
However, the UK and other European stock markets picked up during the day, and the American stock markets opened up ahead of their Tuesday close. We decided to hold tight and wait for the FOMC announcement on Wednesday evening, and then see what the Bank of England did on the Thursday.
The Federal Reserve ended up raising the interest rate by 0.75 percentage points and US markets seemed relieved. The Dow Jones ended the day up 1%, the S&P rose by 1.5%, and the Nasdaq gained 2.5%. It looked as though the tide had turned.
On Thursday, the Bank of England raised interest rates another 0.25 percentage points, which was also in line with expectations. I thought that we might be home and dry. Unfortunately, that was not the case. The FTSE 100 ended the day down 3.1%, the FTSE 250 lost 3%, the German DAX fell by 3.2%, and the French CAC 40 dropped 2.3%. At that point we sold/reduced some of the holdings in our portfolios, taking the cash allocation up to 79% in the ‘Tugboat’ and 61% in the ‘Ocean Liner’.
That evening, the Dow Jones Industrial Average went down 2.4%, the S&P 500 lost 3.3%, and the Nasdaq fell 4.1%.
We are now waiting to see if this is the end of the current rout, or whether there is more trouble brewing.
For more information about Saltydog, or to take the two-month free trial, go to www.saltydoginvestor.com
These articles are provided for information purposes only. Occasionally, an opinion about whether to buy or sell a specific investment may be provided by third parties. The content is not intended to be a personal recommendation to buy or sell any financial instrument or product, or to adopt any investment strategy as it is not provided based on an assessment of your investing knowledge and experience, your financial situation or your investment objectives. The value of your investments, and the income derived from them, may go down as well as up. You may not get back all the money that you invest. The investments referred to in this article may not be suitable for all investors, and if in doubt, an investor should seek advice from a qualified investment adviser.
Full performance can be found on the company or index summary page on the interactive investor website. Simply click on the company's or index name highlighted in the article.