Why I'm optimistic about Avacta shares
This small-cap drug company's share price has doubled since July and has just broken a trendline. Independent analyst Alistair Strang explains what it might mean.
28th October 2025 07:46
by Alistair Strang from Trends and Targets

A prominent member of the cancer industry, Avacta Group (LSE:AVCT)'s share price has been describing some interesting patterns since 2021, manoeuvres which allow us to produce a “back to school” article.
- Invest with ii:Open a Stocks & Shares ISA | Top ISA Funds | Transfer your ISA to ii
To cut to the chase, Avacta is perfectly conforming to our frequent comments regarding the importance of closing prices, when mapping share price movements.
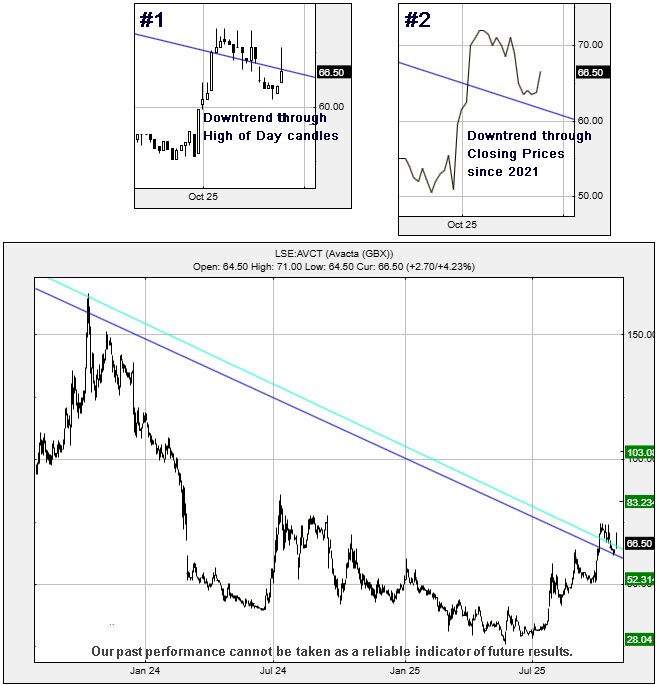
Figure #1 below shows our least favourite mess of a trend line break, where a share price breaks a drop dead obvious trend, retreats below it, then recovers above the trend again. This essentially tosses a bunch of logic into a mincing machine!
Figure #2 below, conversely, shows what happens when closing prices are used. Quite a different picture emerges. To employ common sense, along with some wishful thinking, the share price broke the trend, enjoyed a minor surge, then the price reversed to “test” the level of trend break, a ridiculous expectation but unfortunately one which often seems to happen.
Our conclusion, in these instances, is to make an assumption the market is mapping the share with closing prices, using this for our projections for the future.
Unsurprisingly, once such a determination is made, the prospect for accurate price calculations rises to quite an encouraging level, allowing us to employ the word “confident” in our predictions. In the case of Avacta, it creates a situation where above 74p should now make its way to an initial 83.2p with our secondary, if beaten, a confident looking longer term 103p.
Should things intend to go wrong, below 62p looks dodgy, capable of promoting reversal to an initial 52p with our secondary, if broken, at a completely silly 28p. Unfortunately, our “completely silly” moniker has a problem as it matches share price movements from just a few weeks ago!
For now, we’re pretty optimistic on this one.
Source: Trends and Targets. Past performance is not a guide to future performance.
Alistair Strang has led high-profile and "top secret" software projects since the late 1970s and won the original John Logie Baird Award for inventors and innovators. After the financial crash, he wanted to know "how it worked" with a view to mimicking existing trading formulas and predicting what was coming next. His results speak for themselves as he continually refines the methodology.
Alistair Strang is a freelance contributor and not a direct employee of Interactive Investor. All correspondence is with Alistair Strang, who for these purposes is deemed a third-party supplier. Buying, selling and investing in shares is not without risk. Market and company movement will affect your performance and you may get back less than you invest. Neither Alistair Strang or Interactive Investor will be responsible for any losses that may be incurred as a result of following a trading idea.
These articles are provided for information purposes only. Occasionally, an opinion about whether to buy or sell a specific investment may be provided by third parties. The content is not intended to be a personal recommendation to buy or sell any financial instrument or product, or to adopt any investment strategy as it is not provided based on an assessment of your investing knowledge and experience, your financial situation or your investment objectives. The value of your investments, and the income derived from them, may go down as well as up. You may not get back all the money that you invest. The investments referred to in this article may not be suitable for all investors, and if in doubt, an investor should seek advice from a qualified investment adviser.
Full performance can be found on the company or index summary page on the interactive investor website. Simply click on the company's or index name highlighted in the article.