Why it will pay to own these six quality trusts
We put the case for quality as an investing style and the importance of taking an active approach.
30th August 2019 15:32
For several years, quality as an investing style has dominated, outperforming both value and growth. We examine why the case for quality remains strong and the importance of taking an active approach.

This content is provided by Kepler Trust Intelligence, an investment trust focused website for private and professional investors. Kepler Trust Intelligence is a third-party supplier and not part of interactive investor. It is provided for information only and does not constitute a personal recommendation.
Material produced by Kepler Trust Intelligence should be considered a marketing communication, and is not independent research.
Quality street: can the dominant style continue to outperform?
Thomas McMahon, senior analyst at Kepler Trust Intelligence.
Quality as an investing style has outperformed significantly in recent years, and over the past 12 months especially so. After this kind of outperformance, it is natural to ask whether a trend is over-done and profits should be taken – and that is what we have done.
When analysing the typical quality benchmarks, it quickly becomes apparent that these indices have significant industry and sector exposures, which could affect how they perform in the future and put them at risk of a down period. But the picture is also complicated by the fact "quality" is a hard factor to define, making it crucial to understand the investment process of a manager thoroughly.
In our view, there are good reasons to think that quality, properly defined, could continue to do well. In particular, we think that the strong performance of quality in down markets should appeal given the weakening sentiment towards equity markets this summer.
However, the issues of index composition and the shifting definition of "quality" means that an active approach is preferable to a passive we argue. In this article, we take an in-depth look at the outlook for quality, and consider a selection of trusts taking varied approaches to achieving a strong quality tilt.
A high-quality decade
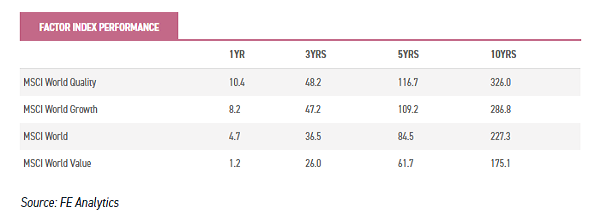
Over the past ten years, the quality factor has outperformed not only the broad stock market, but also the other major factors: growth and value. The MSCI Quality index has returned 326% over the past decade compared to returns of 227.3% for the MSCI World index.
While the growth index did better than the market, it was not as good as quality. Value, no-one will be surprised to hear, underperformed. The pattern is the same over five, three and one-year periods, as the below table shows.
Index composition effects have helped. The MSCI World Quality index has a significant overweight to the USA, and that country has led the world's recovery from the 2008 crash – the MSCI USA is up 348% over ten years, more even than the quality index.
The weighting to the US is now 75.8% in the quality index, compared to 63.3% in the mainstream index. Furthermore, the quality index has also developed a significant overweight to information technology – more than double that in the mainstream benchmark.
The current weight in the quality index is 35%, compared to just 16.6% for the MSCI World. In part, both weightings reflect the success of the country and sector in question – as they have done well, their weighting in the index has risen. However, in particular, the quality index has had the tailwind of these trends behind it over recent times.
We also find quality has worked notwithstanding these tailwinds. The MSCI World ex USA Quality index has a much lower overweight to information technology (11.1% compared to 6.7%). It has outperformed the MSCI World ex USA index considerably over one, three and five year periods (the index does not have a ten-year track record). Over the past 12 months, the ex-US quality index is up 8.49%, compared to just 1.36% for the MSCI World.
End of an era?
After such a strong run, is it time to take profits and look elsewhere? In our view it is important to look at fundamentals rather than worrying about mean reversion, which is merely giving in to the gambler's fallacy - unless backed up by a reasoned case for prices or values to revert to a historic mean.
One of the key reasons we think it will pay to hold quality in the coming years is its strong tendency to protect on the downside. In theory, when markets sell off investors will prefer to hold on to the companies with surer prospects – more secure balance sheets, better profitability, less cyclicality – and sell the more indebted or more economically sensitive ones first. This has been a recognisable pattern in recent years.
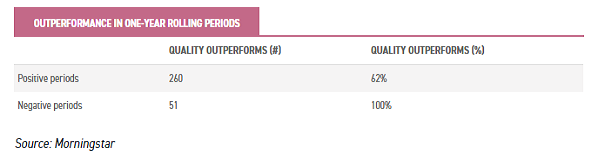
We looked at rolling one-year returns of the MSCI World Quality versus the MSCI World over the past decade, calculated weekly. Of the 760 periods, 419 were positive (this is the period of the recovery since the 2008 crash) and 51 negative. In every single one of the negative one-year periods, quality outperformed the market. In rising markets, quality outperformed 62% of the time.
Downside protection is not just a recent phenomenon. Looking back over twenty years (a period which includes the pre-Lehman world) the MSCI World Quality index has displayed a lower maximum drawdown, lower volatility and lower downside risk than the MSCI World index, and with a beta of just 0.66.
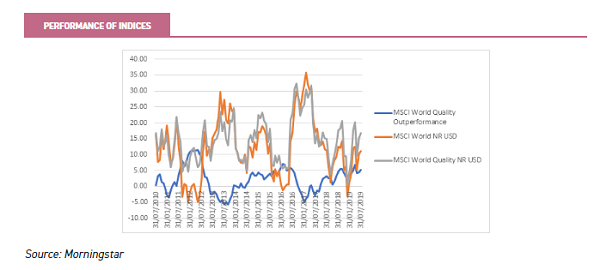
Looking over the past five years, we can see in the graph below that quality has tended to underperform in the sharpest rallies.
The graph shows the relative returns of the MSCI World Quality index versus the MSCI World index in blue over rolling one-year periods. When the line is below zero, the quality index has underperformed over the previous year, and vice versa.
We have also plotted the rolling one-year returns of the two indices. It is immediately apparent that the two main periods of underperformance have come during the sharpest rallies in the market: in mid-2013 and in 2017.
In our view, this type of sharp rally is extremely unlikely in the coming years. With indications being that central banks are likely to cut rates in the near future, or at least keep them lower for longer, a low growth, low rate environment is likely to remain.
This is conducive to a quality style, favouring companies with stable earnings and defendable niches, and those which have earnings that are less dependent on economic growth in the wider economy. The likeliest way out of this state is a recession rather than an inflationary tear at the moment, and in that case we would expect quality to outperform, in line with its impressive record on the downside.
There is another aspect of our current economic and political environment which leads us to favour quality managers over the coming years: the impact of regulation and a sea-change in politics away from lasseiz-faire.
In a forthcoming note, we will be looking into these dynamics and their implications for investors. In our view, the shift towards greater regulation favours companies with deep economic moats, companies often classified as "quality".
The danger in passives
Quality's downside protection characteristics have to be weighed against the risks in the current top-heavy indices.
As discussed above, for investors looking to gain exposure to quality, doing so on a global basis means taking on large US exposure, if a passive investment is used.
The old saying that 'if the US sneezes, the world catches a cold', communicates the tendency of the US economy to lead the global economy into its downturns.
A high weighting to the US could be a significant headwind should the current bearish sentiment towards the US turn out to be warranted, and this could counteract the historic tendency of the quality index to outperform on the downside.
Similarly, on a purely index level, buying quality involves taking on massive IT exposure. On the one hand, this moderates the US risk in that a lot of the US-listed stocks are global businesses rather than dependent on the US economy – Apple (NASDAQ:AAPL), Microsoft (NASDAQ:MSFT), Facebook (NASDAQ:FB) and are all top ten positions in the benchmark.
On the other hand, IT is trading on a premium to the overall market in the US, which might worry some. Furthermore, there is now significant political risk involved in taking on exposure to the US tech giants given the live debate in the US over whether some should be broken up or more aggressively taxed and regulated.
In our view, these are the sorts of risks which justify paying an active manager to assess and deal with. None of these issues will appear in the formulas used to generate a passive quality portfolio, and no situation quite like today's has been experienced in the past.
In short, the composition of the indices means that investors should be wary of buying passive exposure at this point in time. However, we think that picking managers with a quality style is still a good strategy, as long as you are selective.
Why stick with quality?
We have looked at the macro reasons for sticking with quality at the current juncture above. Recent academic research adds another reason to stick with the style over the long run.
In a recent paper, Hsu, Kalesnik and Kose (What is Quality?, Financial Analysts Journal 2019) have showed that some of the key quality metrics used by active managers with a quality style can be proven to have generated alpha.
They looked across the developed world equity markets and found four quality measures to have generated alpha to a statistically significant level across all markets.
These are: high return on equity (ROE), low accruals (i.e. non-cash earnings, a measure of accounting quality), the payout/dilution ratio (net issuance) and conservative investment (measured by low asset growth).
The analysis dated back to 1963 in the case of the US and 1990 in the case of the rest of the developed world, so through multiple market cycles and many different economic environments.
Two other measures which they showed to have added value, both of which are used by many "quality" managers, are earnings stability and low leverage.
However, the authors of the research argue that these are properly understood as components of the low beta effect.
They argue that companies with higher earnings variability are those which have over-optimistic analyst forecasts. Low earnings volatility is therefore undervalued by the market.
Similarly, low leverage is traced back to low volatility in their analysis.
While this is interesting from a theoretical perspective, from a fund-picker's point of view what is key is that these measures work, and if you can regularly identify companies with stable earnings and low leverage then you should be able to outperform the market.
It is worth noting that the MSCI index methodology includes earnings variability and low leverage in the three metrics used to build the index, alongside ROE, which helps explain the strong success of the index.
Conclusion & trust examples
In our view, if you can find managers who focus on these metrics that have been proven to work, then you still stand to do well out of investing in quality trusts.
In fact, the current economic environment could continue to favour quality over growth and value. Below we consider some trusts with an approach that is built on these validated quality (and low beta) measures.
Finsbury Growth & Income (FGT)
A discussion of quality wouldn't be complete without considering Finsbury Growth & Income (LSE:FGT). Nick Train's portfolio has generated 18.8% a year in NAV total return terms over the past decade. He has done so with remarkably consistent outperformance, as we highlighted in a recent strategy note.
There are strong quality elements to his style, although Nick doesn't focus on the accounting metrics we highlight above. Rather, he focuses on finding companies which he thinks have brands or other non-substitutable assets that should ensure they can continue to grow faster than the market over the long run.
Recently he earned some headlines by warning in his monthly commentary that after such a strong run of performance, his portfolios could suffer a period of underperformance.
However, this is not a thesis on the future underperformance of quality stocks, but rather the manager's recognition that his highly-concentrated portfolio has seen excellent returns from a few stocks, and given their valuations, a few stock specific issues (such as those affecting Hargreaves Lansdown) could prompt outsize losses on those positions in the short term.
Fundsmith Emerging Equities Trust (FEET)
Another high-profile manager with a strong quality style is Terry Smith. Terry places more emphasis on the use of accounting metrics, and looks at return on capital employed and the cash quality and repeatability of earnings, both highlighted as effective metrics in the academic research cited above.
Fundsmith Emerging Equities Trust (LSE:FEET) applies his strategy to emerging markets. The output is a portfolio with extreme exposure to consumer staples (66%) and India (43%). In our view, the relatively narrow focus makes it hard to see the trust as a core emerging markets holding.
Terry may be proven right in the long run about where the opportunities are, but the track record of the trust so far – it underperformed the sector by 25% from launch to 5 July 2019 - shows the risks in being concentrated in one geography and sector.
It is worth noting that NAV performance has been strong over the summer, although the discount has widened after Terry announced he would be stepping back from management of the trust into a CIO role. Some might view this as an opportunity. We published a full note on the trust last month.
Aberdeen New India (ANII)
Another trust which is benefiting from India's strong performance after the May election is Aberdeen New India (LSE:ANII). The trust is up 14.6% in NAV total return terms over six months. The MSCI Emerging Markets index is up just 3.2%.
ANII takes a quality approach to investing in Indian equities, which helped it post positive NAV total returns in 2018 when the Asia sector was a sea of red and the MSCI India was down 1.4%. The quality focus is felt in the focus on ROE and sustainable levels of debt, both of which are supported by the academic research cited above.
The portfolio as a whole has a negative debt to equity ratio, meaning it is net cash, which is exceptional even in India where debt to equity levels are low (15.4% on an index level). We published a full note on the trust last week.
Edinburgh Dragon (EFM)
Edinburgh Dragon (LSE:EFM), like ANII, is run by the Asian Equities team at Aberdeen Standard in line with the quality and value approach employed by Aberdeen in the region for three decades. The focus on companies with repeatable earnings, low and manageable debt loads and superior ROEs is in line with the approach of Aberdeen New India.
The focus on corporate governance links in with the focus on ROE and debt loads – they all indicate a company managed with the interests of minority shareholders in mind. The tendency for quality portfolios to do well in poor markets was well illustrated by EFM in the second half of 2018, when the trust outperformed.
Although it is significantly ahead of the index over 12 months, the discount remains wide at 11.4%. We published a full note on the trust earlier this month.
JPMorgan US Smaller Companies (JUS)
Robert Siddles has run Jupiter US Smaller Companies (LSE:JUS) for over 18 years with a focus on valuations but also on quality. He looks for companies with strong franchises (reminiscent of Terry Smith and Nick Train's approach) and good free cash flow.
Two of the four categories of companies in the fund are compounders and companies with valuable assets, both of which have a strong quality angle.
The others are recovery stocks and turnarounds, where the value style is more evident. The trust has outperformed the Russell 3000 benchmark over six months and 12 months. With value significantly underperforming over this period, it is clearly the quality element of the style that has led to the success.
The trust offers exposure to quality and to the USA without the heavy large cap and tech bias evident in the passive quality index. We published a full note on the trust in May.
Scottish Oriental Smaller Companies (SOSC)
Scottish Oriental Smaller Companies (LSE:SST) has seen its more defensive quality style come back into fashion in the Asian markets over the past year. In 2018, the trust outperformed the MSCI AC Asia ex Japan index on the downside, and it has beaten the index on the upside in 2019 too.
There are two "pillars" to manager Vinay Agarwal's approach. One is valuation, the other is quality. With respect to quality, Vinay looks for low gearing and sustainably high ROCE's, both elements supported by the research cited above.
He also pays particular attention to corporate governance, which helps guide him to management teams who are long-termist in their stewardship of their companies.
Vinay pays particular attention to the downside risks to his companies, and places great importance on how management teams have handled difficult periods in the past.
This could help the trust if the current weakening of sentiment is the start of a prolonged period of market and economic weakness. We published a full note on the trust in May.
Kepler Partners is a third-party supplier and not part of interactive investor. Neither Kepler Partners or interactive investor will be responsible for any losses that may be incurred as a result of a trading idea.
Full performance can be found on the company or index summary page on the interactive investor website. Simply click on the company's or index name highlighted in the article.
Important Information
Kepler Partners is not authorised to make recommendations to Retail Clients. This report is based on factual information only, and is solely for information purposes only and any views contained in it must not be construed as investment or tax advice or a recommendation to buy, sell or take any action in relation to any investment.
This report has been issued by Kepler Partners LLP solely for information purposes only and the views contained in it must not be construed as investment or tax advice or a recommendation to buy, sell or take any action in relation to any investment. If you are unclear about any of the information on this website or its suitability for you, please contact your financial or tax adviser, or an independent financial or tax adviser before making any investment or financial decisions.
The information provided on this website is not intended for distribution to, or use by, any person or entity in any jurisdiction or country where such distribution or use would be contrary to law or regulation or which would subject Kepler Partners LLP to any registration requirement within such jurisdiction or country. Persons who access this information are required to inform themselves and to comply with any such restrictions. In particular, this website is exclusively for non-US Persons. The information in this website is not for distribution to and does not constitute an offer to sell or the solicitation of any offer to buy any securities in the United States of America to or for the benefit of US Persons.
This is a marketing document, should be considered non-independent research and is subject to the rules in COBS 12.3 relating to such research. It has not been prepared in accordance with legal requirements designed to promote the independence of investment research.
No representation or warranty, express or implied, is given by any person as to the accuracy or completeness of the information and no responsibility or liability is accepted for the accuracy or sufficiency of any of the information, for any errors, omissions or misstatements, negligent or otherwise. Any views and opinions, whilst given in good faith, are subject to change without notice.
This is not an official confirmation of terms and is not to be taken as advice to take any action in relation to any investment mentioned herein. Any prices or quotations contained herein are indicative only.
Kepler Partners LLP (including its partners, employees and representatives) or a connected person may have positions in or options on the securities detailed in this report, and may buy, sell or offer to purchase or sell such securities from time to time, but will at all times be subject to restrictions imposed by the firm's internal rules. A copy of the firm's conflict of interest policy is available on request.
Past performance is not necessarily a guide to the future. The value of investments can fall as well as rise and you may get back less than you invested when you decide to sell your investments. It is strongly recommended that Independent financial advice should be taken before entering into any financial transaction.
PLEASE SEE ALSO OUR TERMS AND CONDITIONS
Kepler Partners LLP is a limited liability partnership registered in England and Wales at 9/10 Savile Row, London W1S 3PF with registered number OC334771.
Kepler Partners LLP is authorised and regulated by the Financial Conduct Authority.
These articles are provided for information purposes only. Occasionally, an opinion about whether to buy or sell a specific investment may be provided by third parties. The content is not intended to be a personal recommendation to buy or sell any financial instrument or product, or to adopt any investment strategy as it is not provided based on an assessment of your investing knowledge and experience, your financial situation or your investment objectives. The value of your investments, and the income derived from them, may go down as well as up. You may not get back all the money that you invest. The investments referred to in this article may not be suitable for all investors, and if in doubt, an investor should seek advice from a qualified investment adviser.
Full performance can be found on the company or index summary page on the interactive investor website. Simply click on the company's or index name highlighted in the article.