AIM shares: an outlook for the junior market
21st July 2021 08:04
by Alistair Strang from Trends and Targets
After a bad few days for AIM, analyst Alistair Strang scours the charts for clues as to where the market for smaller companies is heading next.

Over the last five years, we’ve often sung the praises of the UK’s junior market as it appeared to have left its, often questionable, behaviour behind. Instead, it tends to perform with considerable strength, far outstripping the once respectable FTSE 100 both in performance and also adherence to what passes for logic in the marketplace. In fact, since the March 2020 pandemic drop, the AIM has tended to mimic the North American markets in strength, leaving the FTSE languishing far behind.
To illustrate just how strong AIM has become, we’ve presented the FTSE 100 as a chart overlay in dark blue (see below). By May of last year, AIM once again left the FTSE in its cloud of broken dreams, soaring onward with true superhero strength.
- Five AIM shares to generate long-term growth for your ISA
- Check out our award-winning stocks and shares ISA
- Why reading charts can help you become a better investor
Thanks to the recent market corrections, which are spoiling the party internationally, there are early signals that AIM shall face some reversals. As a result, it may prove wise in the days ahead to glance at the index before becoming convinced a share is “cheap”. Even in normal times, there’s no such thing as a “cheap” share, internet chatrooms stuffed full of people who felt their 10p bargain could never go lower as everyone said it was "cheap".
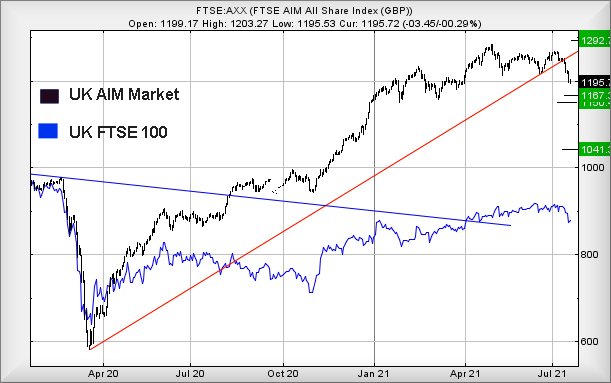
Source: Trends and Targets. Past performance is not a guide to future performance
Our hesitancy comes from AIM market behaviour over the last five sessions. Currently trading at around 1,195 points, the index needs above 1,250 to convince us the recent trend break was fake. The immediate situation isn’t terribly dreadful, suggesting weakness below 1,191 shall commence a reversal cycle to an initial 1,167 with secondary, if broken, at a hopeful bottom of 1,150 points.
There is an unpleasant implication, if the 1,150 level breaks, as the index faces future reversals to a hopeful bottom of 1,041 points.
- 10 exciting growth shares trading higher this year
- Our five AIM tips for 2021 smashing the market at halfway point
- Read the latest news on AIM from our award-winning writer Andrew Hore
At present, we’re inclined favourably toward a viewpoint of 1,150 eventually providing a “bottom” level on the immediate cycle.
In the unlikely event the index somehow finds reason to exceed 1,250, we calculate an initial target of 1,292 with secondary, if bettered, still at our long term 1,368 points, this being a level where we suspect some real turbulence shall prove possible on the AIM.
Alistair Strang has led high-profile and "top secret" software projects since the late 1970s and won the original John Logie Baird Award for inventors and innovators. After the financial crash, he wanted to know "how it worked" with a view to mimicking existing trading formulas and predicting what was coming next. His results speak for themselves as he continually refines the methodology.
Alistair Strang is a freelance contributor and not a direct employee of Interactive Investor. All correspondence is with Alistair Strang, who for these purposes is deemed a third-party supplier. Buying, selling and investing in shares is not without risk. Market and company movement will affect your performance and you may get back less than you invest. Neither Alistair Strang or Interactive Investor will be responsible for any losses that may be incurred as a result of following a trading idea.
These articles are provided for information purposes only. Occasionally, an opinion about whether to buy or sell a specific investment may be provided by third parties. The content is not intended to be a personal recommendation to buy or sell any financial instrument or product, or to adopt any investment strategy as it is not provided based on an assessment of your investing knowledge and experience, your financial situation or your investment objectives. The value of your investments, and the income derived from them, may go down as well as up. You may not get back all the money that you invest. The investments referred to in this article may not be suitable for all investors, and if in doubt, an investor should seek advice from a qualified investment adviser.
Full performance can be found on the company or index summary page on the interactive investor website. Simply click on the company's or index name highlighted in the article.