Andrew Pitts’ 10 conservative investment trust tips: July 2022
26th July 2022 10:08
by Andrew Pitts from interactive investor
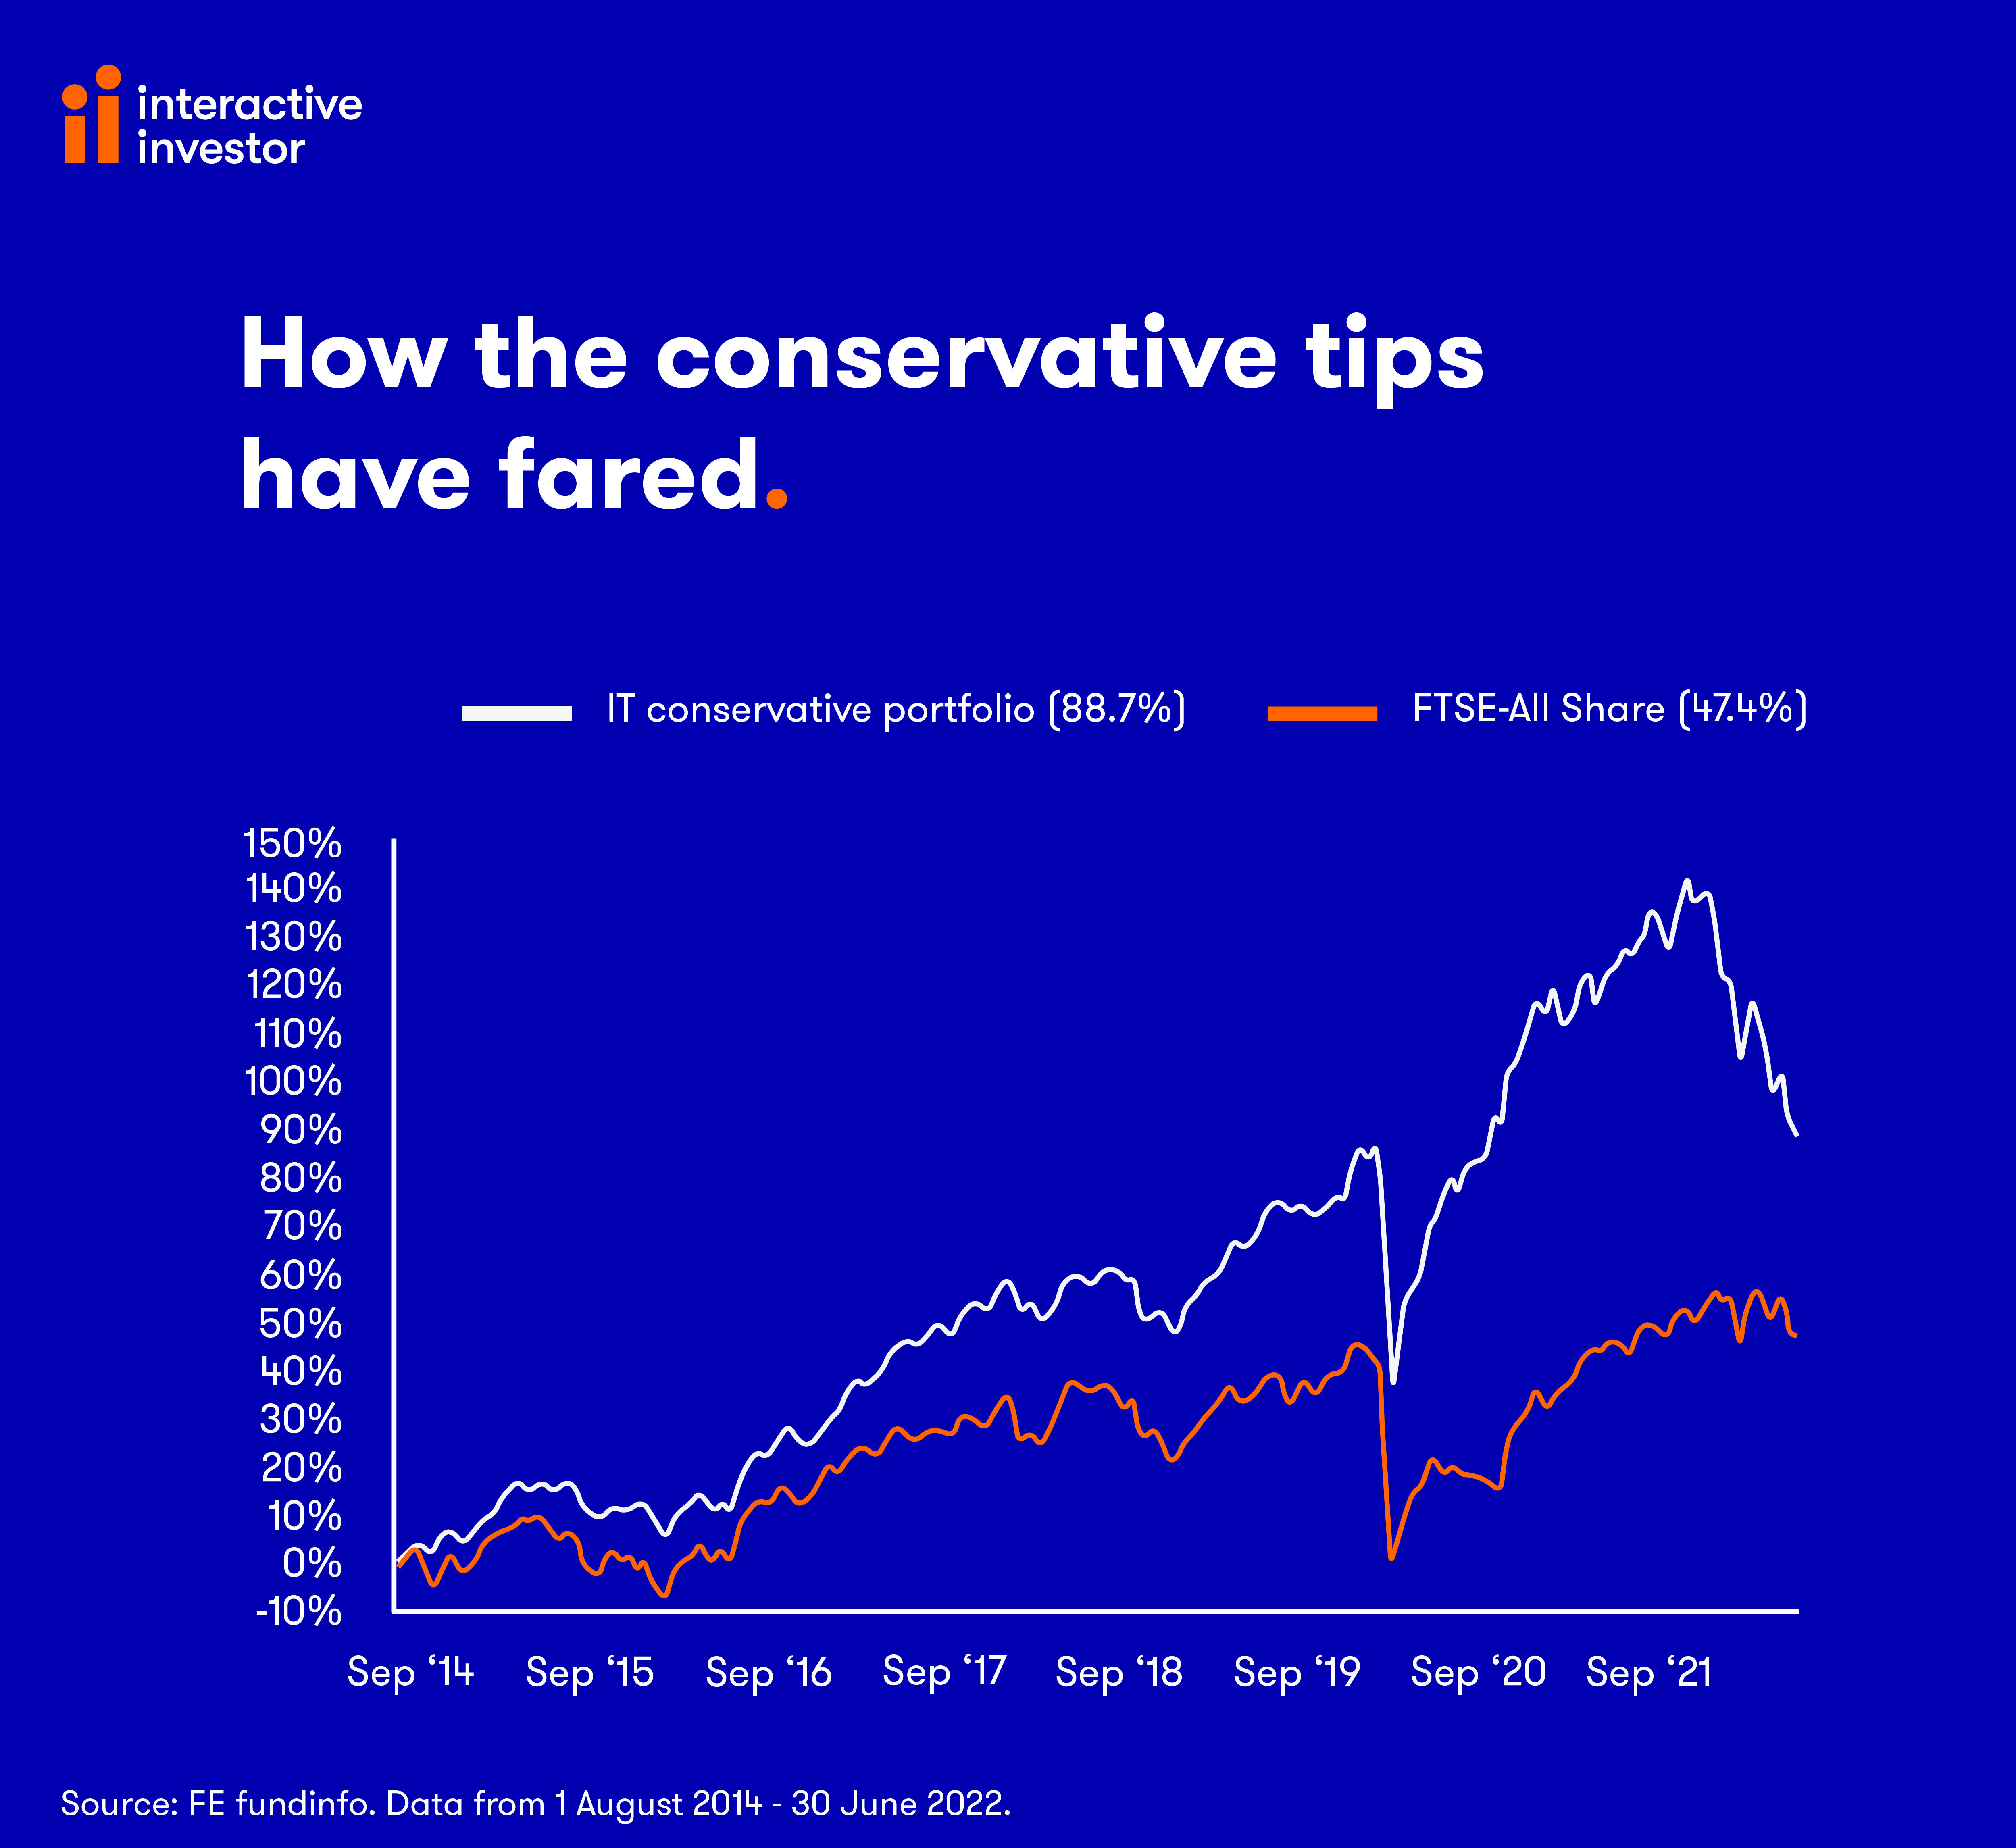
Andrew Pitts names his conservative selections for the next 12 months, many of which are trading on attractive discounts after posting losses in the first half of 2022.

Andrew Pitts’s trust tips (adventurous and conservative portfolios) were first introduced by Money Observer more than 20 years ago. Their performance began to be monitored as portfolios in August 2014. In July 2020, Andrew took over the portfolios. The trust tips are made by Andrew and not interactive investor.
Each portfolio contains 10 trusts split equally between geographic regions or strategies There is an editorial update of the portfolios every quarter. The annual review of the portfolios takes place every July.
Conservative portfolio choices
Global – Bankers
Despite an 11.6% loss over the year to 30 June, Bankers (LSE:BNKR) has shown resilience compared with most of its growth-focused global peers. Although it lost -18.8% in the first half of 2022, its maximum drawdown (reduction in its share price) over three years compares very favourably against peers.
With ongoing charges of just 0.5%, this £1.6 billion trust is beaten only by Scottish Mortgage (LSE:SMT) and Monks (LSE:MNKS) on cost among the 17 trusts in the sector.
Bankers also sports a decent yield of 2.2% - and it aims to increase its annual dividend, which is paid quarterly, at least in line with UK CPI inflation. In the year to 31 October 2021, the dividend was increased for the 55th consecutive year. Reserves equivalent to 1.36 years of last year’s payout will help to maintain the dividend’s inflation-linking.
Lead manager Alex Crooke determines the asset allocation and the portfolio’s UK members, with the remaining investments in this highly diversified trust delegated to regional specialist teams at management group Janus Henderson Investors.
The dividend growth target looks particularly appealing in the current environment.
UK equity income – Finsbury Growth & Income
The 2021 annual review served notice that Troy Income & Growth might be replaced. Finsbury Growth & Income (LSE:FGT) was subsequently introduced in the October quarterly review but despite some initially encouraging performance, it’s been a comparatively rough ride for manager Nick Train (pictured below) in 2022, as well as fans of his distinctive style.
Over the year to end June, the trust’s shares were down -12.2% and have fallen by a similar amount over the past three years, with the trust languishing at or near the bottom of the UK equity income sector. Compounding losses at the portfolio level has been a steady derating of the shares, which at the end of June were trading at an 8% discount to NAV, having traded at close to par for many years until mid-2021. The board aims to limit the discount to NAV to no more than 5% via share buybacks.
- Andrew Pitts' 10 adventurous investment trust tips
- What’s gone wrong at Lindsell Train?
- Andrew Pitts’ trust tips: short-term pain, but long-term gain
The trust focuses on ‘quality growth’ businesses, which Train views as being intrinsically low risk. That approach means the trust’s dividend yield is among the lowest in the sector at 2.3%, compared with an average 3.8% yield. However, FGIT’s annual average dividend growth of 5.5% over five years stacks up well against peers, while its total return over longer time periods speaks for itself – 200% over 10 years, for example.
The highly concentrated portfolio (just 10 holdings account for over 80% of the trust’s £1.9 billion in assets) has arguably compounded recent poor performance, as has the general stock market rotation from companies with ‘growth’ to ‘value’ characteristics.
Despite the trust’s inauspicious start as a member of the Conservative portfolio, Train’s strategy of backing quality-growth companies – particularly those forecast to generate long-term growth in free cash flow – will see a return to form before long.

UK growth – Fidelity Special Values
Fidelity Special Values (LSE:FSV) replaces BlackRock Throgmorton Trust (LSE:THRG) as the conservative portfolio’s UK growth choice. It seeks to invest in equities that the manager perceives as being undervalued or where potential has yet to be recognised by the market.
Manager Alex Wright has been with Fidelity since 2001 and took over managing the trust in 2012, now assisted by Jonathan Winton. A penchant for small to mid-sized companies and being underweight to the energy and basic materials sectors has contributed to underperformance of the FTSE All-Share index benchmark over the past year, but it is a little ahead over three and five years and its 223% return over 10 years is more than double that of the FTSE All-Share index.
The portfolio is well diversified by size and sector. The top 10 equity holdings – led by Serco (LSE:SRP), Imperial Brands (LSE:IMB) and French company Sanofi (EURONEXT:SAN) – account for 32% of the portfolio, while the top 50 represent 88%.
Shares in the £1.1 billion trust are available on a discount to NAV and there is a useful dividend yield of 2.5%, with average annual dividend growth of 12.5%.
Europe – Henderson EuroTrust
Manager Jamie Ross said a few years ago that his focus on “high-quality, high-return and resilient companies, or companies that I think can one day meet this criteria” might mean that Henderson EuroTrust (LSE:HNE) could lag when sentiment is strong.
Today, with sentiment in Europe extremely weak, it is disappointing to see the trust’s -23% loss over the year compare very unfavourably with the -10.1% registered by the benchmark MSCI Europe ex UK Index.
Although the discount to NAV has widened from 10% to around 15% over the past year, the £295 million trust’s total return has fallen significantly behind the benchmark, registering around half of the index’s return over three and five years.
Having made a strong start after his elevation to lead manager in October 2018, the last few years have been disappointing to say the least. However, I’m reluctant to make a switch when market sentiment is so poor, compounded by the fog of war in Ukraine, while also bearing in mind that the benchmark index is heavily weighted to oil and gas companies, which represent less than 5% of the portfolio.
Past performance is not a guide to future performance.
North America – JPMorgan American
JPMorgan American (LSE:JAM) continues to do a good job for the conservative portfolio and has navigated the choppy US stock market with aplomb. Over the year the shares are up 4.6% compared with a 1.2% gain from the benchmark S&P 500, which it has also beaten over three, five and 10 years.
Managers Jonathan Simon and Timothy Parton combine both growth and value disciplines when selecting stocks, which has proven to be a useful approach given the market rotation from the former to the latter over the past year.
The £1.5 billion trust invests in around 40 mainly mega- and large-sized companies. Compared with the index it is meaningfully underweight to information technology and consumer staples and overweight to financials. Ongoing charges are very competitive at 0.38% and the shares traded at the end of June on a 4.5% discount to NAV.
Emerging markets – JPMorgan Emerging Markets
Despite turning in a below-average performance compared with its peers over the past year, it is worth sticking with JPMorgan Emerging Markets (LSE:JMG)’ winning formula, which has been tried and tested over longer time periods.
In the year to 30 June, the trust’s share price was down 20.6%, while the discount to NAV has widened a little to around 10%. But the trust has more than doubled the return from the MSCI Emerging Markets benchmark over five years and is nearly just as far ahead of the index over 10.
Austin Forey has run the trust, a member of interactive investor’s Super 60, since 1994 and was joined by co-manager John Citron in March last year.
Japan – JPMorgan Japanese
About the only positive comment about JPMorgan Japanese (LSE:JFJ)’s year is that the management team, led by Nicholas Weindling and Miyako Urabe, have been accorded a ‘Gold’ Morningstar Analyst Rating. It’s notable that the team behind this £880 million trust are alone in receiving this accolade among Morningstar’s global database of around 900 Japanese equity ‘large-cap equity’ funds.
Unfortunately, this has not been reflected in recent results, with the trust’s loss of -32% over the year significantly under the Topix Index benchmark loss of -8% in sterling terms.
In the recent half-year report released in May, chair Christopher Samuel reminded investors that the manager’s “high conviction, unconstrained approach focused on finding the best investment ideas in Japan” would lead to periods of underperformance, “particularly given the recent shift in sentiment towards cyclical and value companies”.
Although recent results have been discomforting, the conservative portfolio is sticking with this trust in the expectation that when sentiment turns again, it will resume its progress and rebuild its very good long-term record. The shares traded at the end of June on a discount to NAV of -7.8%.
- Where to invest in Q3 2022? Four experts have their say
- Funds and trusts four professionals are buying and selling: Q3 2022
- Listen to the latest episode of our Funds Fan podcast: winners and losers so far in 2022, and why small-caps outperform
Asia ex-Japan – Schroder Asian Total Return
It’s disappointing that the capital preservation-minded strategy behind this £501 million trust has not given investors more protection at the share price level. Its 18% loss is not too far behind the MSCI AC Asia-Pacific ex Japan index benchmark over the past year, but performance took a marked turn for the worse in the first half of 2022.
That said, the trust’s longer-term record remains compelling and the shares at the end of June traded at a -5% discount whereas they traded at a small premium for most of 2021.
Managers Robin Parbrook and King Fuei Lee continue to have faith in the info tech and consumer discretionary sectors, which account for 40% and 16% of the portfolio respectively, led by Taiwan Semiconductor (NYSE:TSM) and Samsung Electronics (LSE:SMSN).
Although the trust is currently 12% geared, it has also been employing derivatives strategies representing -6% of the portfolio to help minimise downside risk. The trust also yields 2.1% with dividends paid quarterly.

Private equity – Pantheon International
Large share price discounts to NAV are not unusual among private equity trusts and at -45% Pantheon International (LSE:PIN)’s is among the widest – and nearly double the average discount in this sector of 16 trusts.
Interestingly, private equity trusts have so far held up relatively well compared with public markets: over the past year Pantheon International is down -9.3%, although the NAV was up by 28%. The collapse in the trust’s discount to NAV accounts for the difference, as investors fret about rising rates, inflation and a global downturn.
In the future, the conservative portfolio should benefit from Pantheon’s high-quality and globally diversified holdings, which should provide lower risk exposure to the asset class. Analysts at stockbroker Investec note the £2.4 billion trust’s prudently managed balance sheet, “a significant depth of resource, complemented by deep relationships with leading private equity managers that have been built up over many cycles”.
Specialist – Capital Gearing
It is pleasing to see that shares in Capital Gearing (LSE:CGT), a member of the interactive investor Super 60, are among the trio of trusts in either portfolio to have registered a gain over the year, with a share price total return of 2.9%.
The £1.15 billion trust has an implicit aim of preserving shareholders’ wealth, with a greater emphasis on avoiding loss than maximising returns.
Managers Peter Spiller (who has steered the trust’s fortunes for 40 years), Alastair Laing and Chris Clothier have held large positions in index-linked bonds and other fixed interest securities over several years to achieve this aim. Since 2000, the maximum drawdown from the trust’s value has been -9%. But over the past five years, the average annual share price total return has been 5.8%, compared with 3.7% for the MSCI UK Index.
How the conservative portfolio constituents fared in the past year and beyond*
| % share price total return and AIC sector quartile rank after: | |||||||||||
| Name | Sector (no. of members) | 3 mths | Rk | 6 mths | Rk | 1 year | Rk | 3 yrs | Rk | 5 yrs | Rk |
| JPMorgan American | North America (9) | -11.68 | 2 | -11.22 | 2 | 4.65 | 2 | 53.32 | 2 | 90.07 | 2 |
| Capital Gearing | Flexible Investment (30) | -2.24 | 2 | -2.61 | 2 | 2.87 | 2 | 20.77 | 1 | 32.91 | 1 |
| Pantheon International | Private equity (21) | -22.1 | 4 | -27.08 | 4 | -9.26 | 4 | 14.75 | 3 | 35.36 | 3 |
| Bankers | Global (17) | -8.46 | 2 | -18.79 | 3 | -11.55 | 2 | 12.28 | 2 | 40.27 | 2 |
| Finsbury Growth & Income | UK equity income (25) | -8.04 | 3 | -15.63 | 4 | -12.16 | 4 | -10.56 | 4 | 18.68 | 2 |
| Schroder Asian Total Return | Asia Pacific (6) | -6.88 | 3 | -18.66 | 4 | -18.01 | 4 | 15.72 | 2 | 41.17 | 1 |
| JPMorgan Emerging Markets | Global emg mkts (11) | -7.89 | 3 | -17.56 | 3 | -20.63 | 3 | 8.91 | 1 | 41.5 | 1 |
| Henderson EuroTrust | Europe (7) | -11.85 | 3 | -22.9 | 3 | -23.32 | 3 | 5.21 | 3 | 10.38 | 2 |
| JPMorgan Japanese | Japan (7) | -18.05 | 3 | -36.17 | 4 | -31.86 | 3 | -1.02 | 3 | 18.44 | 1 |
| BlackRock Throgmorton † | UK smaller cos (25) | -27.59 | 4 | -43.44 | 4 | -40.3 | 4 | 0.58 | 3 | 39.21 | 1 |
Notes: * Holdings ranked by one-year performance. Not all constituents were members of the portfolios over the time periods stated. † Trust name in italics indicates that a change to the portfolio has been made. See text for details. Data source: FE Analytics as at 30 June 2022. Past performance is not a guide to future performance.
Data sources: Association of Investment Companies (AIC), FE Analytics and company reports. Performance relates to shareholder total return unless indicated. Both performance and discount figures are as at 30 June 2022. When discussing trust size, this article has referred to total assets rather than market capitalisation and were referenced in the second week of July.
Andrew Pitts was editor of Money Observer from 1998 to 2015. He has a personal investment in Capital Gearing.
These articles are provided for information purposes only. Occasionally, an opinion about whether to buy or sell a specific investment may be provided by third parties. The content is not intended to be a personal recommendation to buy or sell any financial instrument or product, or to adopt any investment strategy as it is not provided based on an assessment of your investing knowledge and experience, your financial situation or your investment objectives. The value of your investments, and the income derived from them, may go down as well as up. You may not get back all the money that you invest. The investments referred to in this article may not be suitable for all investors, and if in doubt, an investor should seek advice from a qualified investment adviser.
Full performance can be found on the company or index summary page on the interactive investor website. Simply click on the company's or index name highlighted in the article.