Bond Boss: are money market funds still a good deal?
Money market funds have been the go-to for cautious investors, riding the wave of rising interest rates. But with central banks now pivoting towards rate cuts, the ‘cash is king’ era may be losing its crown.
11th November 2025 12:10
by Jonathan Mondillo from Aberdeen

Despite predictions of a mass exodus from money market funds, delayed rate cuts have kept investors parked in cash.
Now, with the Bank of England shifting its focus from inflation to economic growth, a path to lower rates over the next year is becoming clearer. It could also change the game.
- Invest with ii: Money Markets| Bond Yields| Tax Rules for Bonds & Gilts
Is cash still relevant?
Market volatility hasn’t gone away. From trade tension to fiscal uncertainty, investors still crave stability – and money market funds have delivered just that.
But investors face an unavoidable question: how long will yields on money market funds remain attractive, given the predicted downward path for interest rates?
The good news? We’re unlikely to return to a near-zero interest rate environment anytime soon. Inflation remains sticky due to structural forces such as de-globalisation, rising government debt (including Europe’s defence spending spree) and tighter labour markets. That means central banks will likely cut rates slowly.
Aberdeen economists forecast UK interest rates will ease from 4% to 3.75% by year-end and to 3% by the close of 2026. For investors seeking low-risk income, those levels can still play a useful role in a balanced portfolio.
Chart 1: Aberdeen Investments’ interest rate forecasts

Source: Aberdeen Investments 21 October 2025.
Alternatives to money market funds
If you’re worried about falling yields on cash, short-dated credit could be a smart next step.
Cash is unbeatable for low volatility and minimal risk of drawdowns. But that safety comes at the cost of lower returns. Short-dated corporate bonds (Corps), by contrast, can offer a yield increase for only a slight increase in risk.
Historically, short-dated credit has been one of the most resilient corners of the bond market. Indeed, the Bank of America 1-3 Year Global Corporate Index has recorded a negative return just once in the past 28 calendar years.
Over the same period, short-dated credit has outperformed cash in most market conditions (see below). The chart focuses on US credit, but the performance is mirrored in sterling and euro markets.
Put simply: for investors looking to enhance their portfolio's yield, short-dated credit has delivered higher returns over the last decade without straying far from the safety of cash.
Chart 2: performance and stability over 10 years
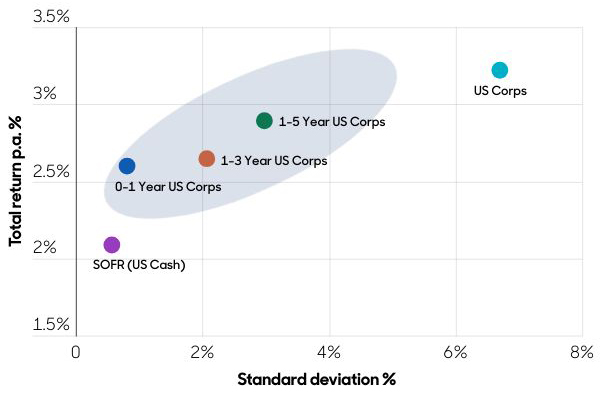
Source: Aberdeen Investments, ICE indices, 30 September 2025. Standard deviation measures how much each return (or data point) differs from the average return over the 10-year period. A lower standard deviation indicates returns are closer to the average - so more predictable.
Won’t the yield on short-dated credit also fall as rate cuts materialise?
Not necessarily. While money market yields tend to drop quickly as rates fall, short-dated credit is a different story.
Markets have already priced in many of the expected rate cuts for late 2025 and into 2026. That means yields on short-dated bonds may not move much lower. Case in point: after the Bank of England’s 0.25% cut in August, 2-year gilt yields barely budged around the event.
Today, the 1-3-year sterling corporate bond index offers a yield of around 4.6%, about 0.6% higher than cash. In fact, that yield gap may widen as interest rate cuts force money market yields lower, an outcome where short-dated credit can give investors a stronger income edge.
And even if yields do fall slightly, investors in short-dated credit could benefit from rising bond prices – an outcome that money market funds can’t deliver.
Investors can also broaden their horizons globally, exploring opportunities in higher-yielding regions such as Asia and emerging markets. These markets are often less correlated with developed economies and can provide important diversification benefits. For example, Asian corporate bonds typically offer higher yields relative to developed markets due to strong regional growth dynamics.
Meanwhile, for ultra-cautious investors, bonds with less than one year to maturity can offer near-cash volatility with greater scope for upside, as seen in the scatter plot chart above.
Chart 3: yield % on sterling indices
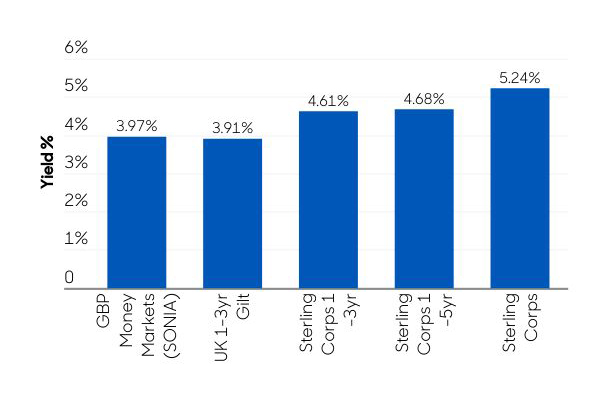
Source: Aberdeen Investments, ICE Indices, 30 September 2026. The yield that would be realised on a bond or other debt instrument if the security was held until the maturity date. SONIA (Sterling Overnight Index Average) is the average rate at which banks borrow money overnight in sterling.
Final thoughts…
Interest rates might be falling, but they are likely to remain well above the ultra-low levels of the last decade. That means a cash allocation can remain an important part of a balanced portfolio, offering near-risk-free yield and welcome stability.
But for investors willing to take on a little more risk, short-dated credit is worth a look. With higher yields and a resilient track record, it’s a compelling way to limit yield erosion as rates decline. By adding global exposure, such as Asian and emerging market bonds, investors can diversify their portfolios and access higher-yielding opportunities that complement traditional sterling or euro credit allocations.
We believe this approach offers investors the smart way to step out of cash – adding yield without losing sleep.
A big thank you to Adam Dmochowski for sharing his expertise and thoughtful perspectives on this topic.
Jonathan Mondillo is global head of fixed income at Aberdeen.
ii is an Aberdeen business.
Aberdeen is a global investment company that helps customers plan, save and invest for their future.
Funds that focus on short-dated bonds
The tables below have been put together by interactive investor – without any involvement from Jonathan Mondillo. The tables are simply illustrations of some of the options available.
The first table highlights the three largest active funds in the Sterling Corporate Bond – Short Term Morningstar Category.
Fund | Size | Current yield (%) | One-year return (%) | Three-year return (%) | Five-year return (%) |
£3.5 billion | 4.05 | 6.1 | 19.3 | 13.2 | |
£1.5 billion | 5.70 | 8.8 | 28.0 | 20.4 | |
£1.4 billion | 3.80 | 6.0 | 19.5 | N/A* |
Performance data from Trustnet, to 5 November 2025. Yield and fund size figures from Morningstar. *Due to fund not having a long enough track record. Past performance is not a guide to future performance.
The second table highlights an active fund and a passive fund that have been picked out by the fund analyst team at interactive investor. The pair have been chosen on the grounds of our analysts being familiar with the funds, and do not form part of our Rated Lists, including the Super 60.
Given that interest rates have been falling, and the next move is expected to be a further decline, the ii analysts are favouring funds with low duration risk (sensitivity to interest rates).
Options include L&G Short Dated £ Corporate Bond Index I Inc fund, which invests in short-dated company bonds with less than five years to maturity, which tend to be less sensitive to changes in interest rates than longer-dated bonds.
Another option is abrdn-Short Dated Enhanced Income X MInc Hdg GBP fund, which invests predominantly in US dollar-denominated corporate bonds, but also has some exposure to sterling and the euro. The fund has a maximum portfolio duration of two years (currently 1.5 years).
Fund | Size | Current yield (%) | One-year return (%) | Three-year return (%) | Five-year return (%) |
£2.5 billion | 3.88 | 7.2 | 21.3 | 10.9 | |
£437 million | 4.42 | 6.1 | N/A* | N/A* |
Performance data from Trustnet, to 5 November 2025. Yield and fund size figures from Morningstar. *Due to fund not having a long enough track record. Past performance is not a guide to future performance.
These articles are provided for information purposes only. Occasionally, an opinion about whether to buy or sell a specific investment may be provided by third parties. The content is not intended to be a personal recommendation to buy or sell any financial instrument or product, or to adopt any investment strategy as it is not provided based on an assessment of your investing knowledge and experience, your financial situation or your investment objectives. The value of your investments, and the income derived from them, may go down as well as up. You may not get back all the money that you invest. The investments referred to in this article may not be suitable for all investors, and if in doubt, an investor should seek advice from a qualified investment adviser.
Full performance can be found on the company or index summary page on the interactive investor website. Simply click on the company's or index name highlighted in the article.