Bond Boss: relief rallies and volatility - bonds still the real stress test
There’s still stress in the market, but the starting point for bonds is better than it has been for many years. The overall yield is attractive, with investment-grade bonds yielding over 5% - well above the 10-year average.
18th May 2026 13:36
by Jonathan Mondillo from Aberdeen

Global markets have been pulled in opposite directions in recent weeks. Equity indices have rebounded sharply, given improving US-Iran headlines and resilient earnings. But government bond markets are still expecting high levels of uncertainty. That divergence matters. Bonds are not simply reacting to daily news; they are signalling that the ‘real’ macro stress test – inflation and policy constraints – is still very much under way.
- Invest with ii: Buy Bonds | Free Regular Investing | General Investing with ii
It’s the geopolitics, stupid
At first glance, the recent equity rally and the fact that corporate bonds are offering investors a smaller extra return over government bonds looks reassuring. Riskier assets (such as equities and corporate bonds) are expressing a medium-term growth view that assumes today’s shocks will ease.
Government bond markets are telling a more negative story. There is still stress evident in the market – you can see it in higher short-term interest rates and in the gap between short- and long-term bond yields being smaller than usual. Yields increasingly reflect an outlook shaped by geopolitics rather than by incremental macro data.
This also highlights why bonds often act as early warning indicators during geopolitical crises. Bond investors are forced to confront inflation and supply risks immediately. Equity markets can afford to avoid them for longer.
The gap between short- and long-term interest rates (the yield curve) is flashing red, too. Until the end of February, most major economies saw inflation slowly declining towards target. The US-Iran conflict has raised the chance of more interest-rate rises, which is pushing up short-term borrowing costs.
- Bond funds: interest rate outlook and how to look under the bonnet
- Three corporate bonds make first move to appeal to DIY investors
Short-term rates are still much lower than long-term rates, but signs of inflation are starting to pick up again. The bond market is telling us that inflation risks are still present under the surface. Ten-year Treasury (US government bond) rates remain well above the 0.5%-3% range we’ve been accustomed to over the past decade.
Volatility is still a key driver
The result is a clear divergence in how different asset classes are behaving. Equities are pricing-in resilient earnings and a degree of optimism – reinforced by repeated episodes of buying when markets fall. Government bonds (loans made to governments), by contrast, are showing short-term uncertainty over inflation and policy risk. Investment-grade bonds (loans to financially stronger companies) and high-yield credit (loans to weaker or indebted companies) currently sit closer to equities. Investors are staying positive about the next few years and taking advantage of today’s higher yields.
Volatility still matters. Chart one compares interest-rate volatility with the extra yield that investment-grade have offered compared with US government bonds over the past five years.
Investors demand a higher risk premium during times of stress as volatility raises uncertainty. We are seeing this feed through into the extra yield investors demand for credit risk, even when default fundamentals remain benign.
After a spike higher, interest-rate volatility has fallen from its highs since the initial Iran war-driven shock. Credit markets have improved and risk premiums have fallen, as a result. Some caution is advisable, though, as the market is susceptible to another volatility spike if energy prices remain elevated.
Chart 1: How bond spreads compare with market volatility estimates
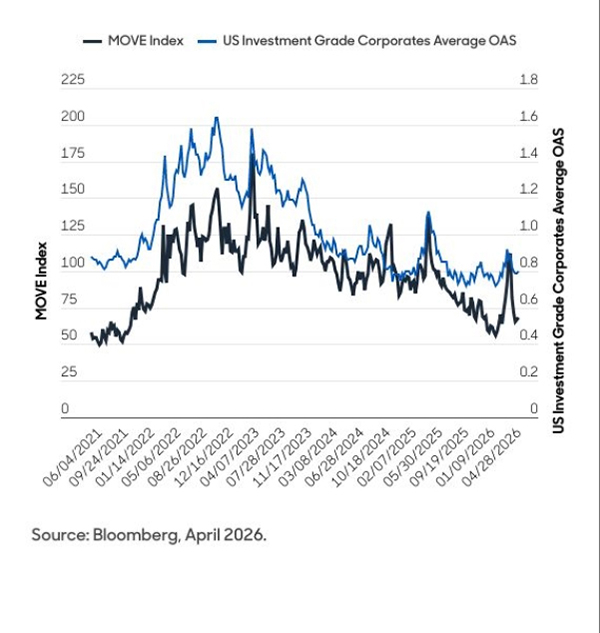
Source: Bloomberg, April 2026. MOVE Index – Merrill Lynch Option Volatility Estimate. OAS Index – Option-Adjusted Spread.
Natural diversifiers
Equities and bonds are often thought of as natural diversifiers – consider the 60% equities/40% bonds portfolio favoured by many. However, history offers important context. Equities and bonds don’t always move together – it depends on what’s driving markets at the time. Inflation stress, in particular, can cause major swings in the equity-bond correlation.
Chart 2: US equity and bond correlation over time
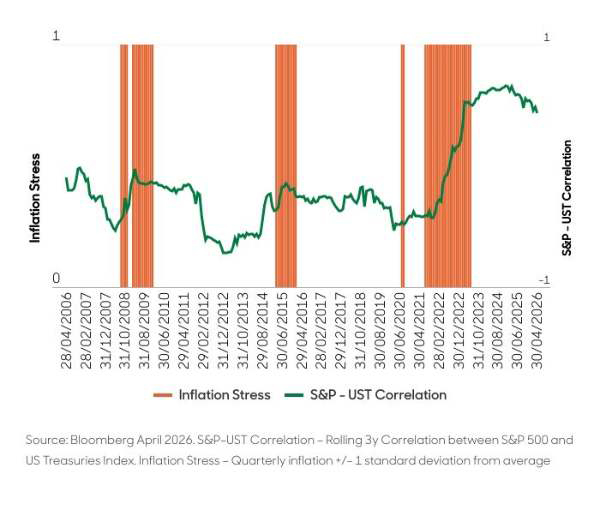
Source: Bloomberg April 2026. S&P-UST Correlation – Rolling 3y Correlation between S&P 500 and US Treasuries Index. Inflation Stress – Quarterly inflation +/- 1 standard deviation from average.
Our analysis of US equities and government bonds (chart two) shows that the diversification benefit of owning bonds over equities tends to break down during periods of large or volatile inflation moves. We see similar evidence of this when comparing the FTSE 100 and government bonds in the UK market. Equity and bond diversification improved (the correlation declined) when inflation was low or below policymakers’ targets – such as during the mid-2010s. But we saw the opposite after the Global Financial Crisis and again during the post-Covid inflation shock.
Current inflation uncertainty remains high and the equity-bond correlation is strongly positive. Diversification benefits may be less reliable, as we’ve seen in recent weeks. When that happens, asset allocation choices matter more.
What should investors do now?
Sharp market rebounds don’t automatically mean that risks have cleared – we’re probably not out of the woods yet. Today’s divergence across asset classes reflects differing time horizons and sensitivities, not a clean resolution to uncertainty. For investors navigating volatile conditions, paying attention to what bond markets are signalling remains essential – even, or especially, when equities appear calm.
We think current conditions present an opportunity to add to bond exposures. The starting point for bonds is materially better than it has been for many years. The overall yield on offer is very attractive, even though the extra return you receive for taking credit risk is relatively low. Investment-grade bonds are yielding over 5%, which is well above the 10-year average. This offers investors attractive total returns. For investors more concerned about downside risks, sovereign bonds also offer generous yields, with more defensive characteristics.
- Bond Boss: myth vs market reality for this high-yielding area
- Sign up to our free newsletter for investment ideas, latest news and award-winning analysis
For investors weighing up government versus corporate bonds, the right mix depends on your risk appetite and existing portfolio tilts. However, the main point still stands: bonds offer a much more attractive balance of income and protection than has been available for much of the past decade.
In a market still dominated by geopolitical inflation risk, we believe bonds – not equities – remain the more reliable way to stay invested. Cross-over credit strategies, which is the space where the lowest tier of investment grade (BBB) debt meets the highest tier of high yield (BB), can offer the potential for higher return, while keeping risks at a more moderate level. Meanwhile, enhanced-income strategies can help investors to achieve a steady income over cash, with reduced volatility.
Jonathan Mondillo is global head of fixed income at Aberdeen.
ii is an Aberdeen business.
Aberdeen is a global investment company that helps customers plan, save and invest for their future.
These articles are provided for information purposes only. Occasionally, an opinion about whether to buy or sell a specific investment may be provided by third parties. The content is not intended to be a personal recommendation to buy or sell any financial instrument or product, or to adopt any investment strategy as it is not provided based on an assessment of your investing knowledge and experience, your financial situation or your investment objectives. The value of your investments, and the income derived from them, may go down as well as up. You may not get back all the money that you invest. The investments referred to in this article may not be suitable for all investors, and if in doubt, an investor should seek advice from a qualified investment adviser.
Full performance can be found on the company or index summary page on the interactive investor website. Simply click on the company's or index name highlighted in the article.