Dividend Danger Zone: Be careful with these nine high-yielding shares
20th June 2018 10:05
by Kyle Caldwell from interactive investor
There are two new entrants to our dividend danger zone screen, which picks out shares that may disappoint investors on the dividend front.
Our screen, which was devised at the end of 2017, has already picked off its first victim: Inmarsat, a satellite communications company that charges commercial airlines to use its services, announced in March that it will cut future yearly payouts in order to invest money back into its business.
SSE and Stobart Group Ltd have entered the screen, which is updated each month.
In the case of SSE, one of the 'Big Six' energy companies, the firm has recently moved to reassure shareholders after laying out its dividend plans for the next five years. A dividend cut, for the first time in its history, will take place next year, as part of a restructure that will see the planned merger of its retail supply business with Npower. After the dividend cut, SSE will target dividend growth in line with RPI inflation until March 2023.
Stobart Group has also announced its future dividend intentions, indicating it is financially resourced to pay the dividend through to 2022. But with a dividend cover score of 0.4 times, some analysts are concerned, including Simon McGarry, of Canaccord Genuity, the wealth manager, who created the dividend danger zone screen.
There's plenty to be positive about; the business is highly diversified and its latest results at the end of February show that underlying pre-tax profits have jumped from £27.4 million to £117 million.
McGarry, though, cautions that dividends won't be paid out of cashflow because the company is not generating enough excess cash. Instead, he says, over the next four years "assets will need to be sold for the dividend to be paid."
He adds that it is also worth bearing in mind Neil Woodford owns 20% of Stobart Group.
"This is an added risk, particularly given that Woodford has been seeing redemptions from his funds," says McGarry.
The seven other shares listed in the table below featured in the screen last month. Exiting the screen are Pennon Group and National Grid.
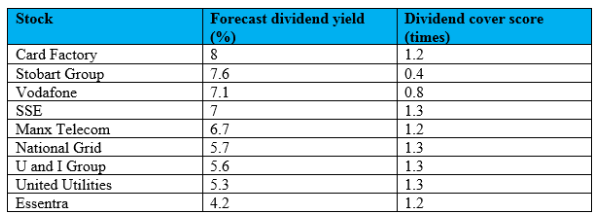
Source: interactive investor Past performance is not a guide to future performance
The mechanics behind the screen
We applied the following filters: a market cap of over £200 million, a dividend yield of 4% (higher than the FTSE 100 average) and a dividend cover score of below 1.4 times. Two other filters were also applied: the first filtered out companies that appear in a financially sound position to pay off their debts, while the second excluded firms with positive earnings per share momentum for the next three months.
Full performance can be found on the company or index summary page on the interactive investor website. Simply click on the company's or index name highlighted in the article.
These articles are provided for information purposes only. Occasionally, an opinion about whether to buy or sell a specific investment may be provided by third parties. The content is not intended to be a personal recommendation to buy or sell any financial instrument or product, or to adopt any investment strategy as it is not provided based on an assessment of your investing knowledge and experience, your financial situation or your investment objectives. The value of your investments, and the income derived from them, may go down as well as up. You may not get back all the money that you invest. The investments referred to in this article may not be suitable for all investors, and if in doubt, an investor should seek advice from a qualified investment adviser.
Full performance can be found on the company or index summary page on the interactive investor website. Simply click on the company's or index name highlighted in the article.
This article was originally published in our sister magazine Money Observer, which ceased publication in August 2020.
These articles are provided for information purposes only. Occasionally, an opinion about whether to buy or sell a specific investment may be provided by third parties. The content is not intended to be a personal recommendation to buy or sell any financial instrument or product, or to adopt any investment strategy as it is not provided based on an assessment of your investing knowledge and experience, your financial situation or your investment objectives. The value of your investments, and the income derived from them, may go down as well as up. You may not get back all the money that you invest. The investments referred to in this article may not be suitable for all investors, and if in doubt, an investor should seek advice from a qualified investment adviser.
Full performance can be found on the company or index summary page on the interactive investor website. Simply click on the company's or index name highlighted in the article.