eyeQ: warnings flash on fintech rally
Experts at eyeQ use AI and their own smart machine to analyse macro conditions and generate actionable trading signals. Here, it spots a textbook set-up eyeQ is built to flag.
28th May 2026 10:15
by Kabir Chugani from eyeQ

“Our signals are crafted through macro-valuation, trend analysis, and meticulous back-testing. This combination ensures a comprehensive evaluation of an asset's value, market conditions, and historical performance.” eyeQ
- Discover: eyeQ analysis explained | eyeQ: our smart machine in action | Glossary
Global X FinTech ETF*
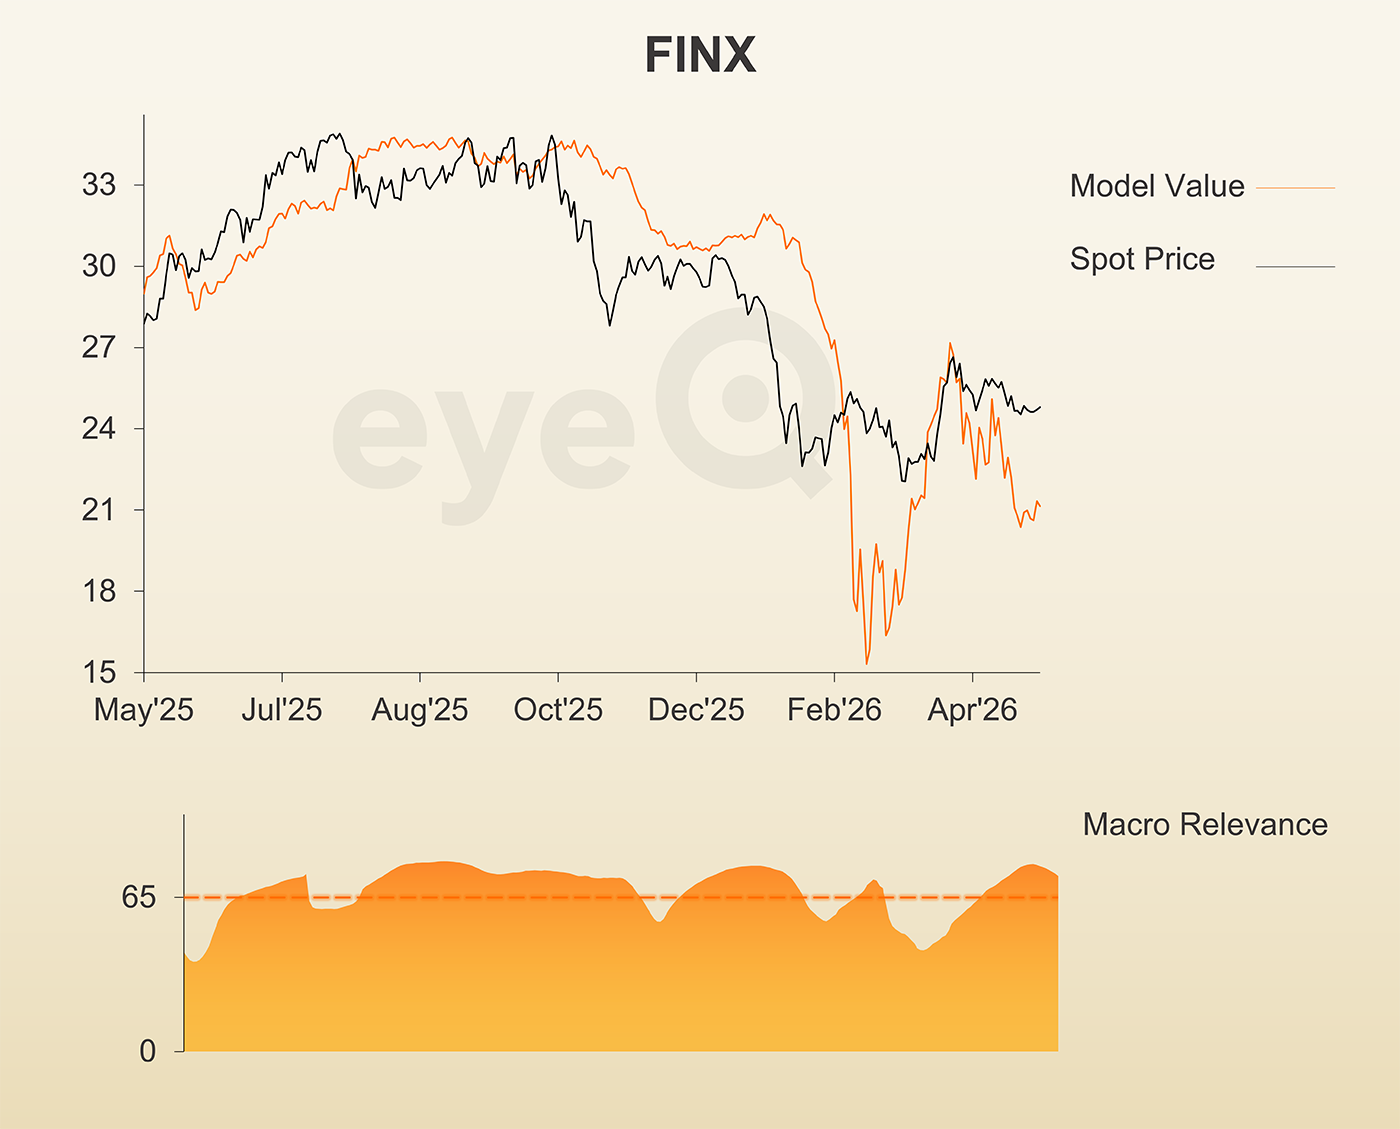
Macro Relevance: 74%
Model Value: 21.33
Fair Value Gap: 14.62% premium to model value
Data correct as at 28 May 2026. Please click glossary for explanation of terms. Long-term strategic model. *Data is for the US-listed ETF only. You can find a UK version here: Global X FinTech ETF USD Acc (FINX)
Macro is starting to matter more for Global X FinTech ETF, and what it’s saying isn’t good for the bulls.
FINX itself is a basket of listed fintech names. Payments processors, digital lenders, crypto-adjacent plays. It’s how many investors get diversified exposure to the companies trying to reshape how money moves.
The big-picture economy is now explaining more than 74% of where FINX trades, and that share is still climbing. When macro is doing that much of the work, what the model says about fair value carries real weight. And right now, the model says FINX is rich. The close sits at 24.97 against a model value of 21.33, a gap of roughly 14.6%.
The harder detail is what the model value is doing. It’s drifting lower. The gap isn’t just static, it’s opening from both sides. Price is up there on its own story, while the macro-implied floor is quietly sinking. That combination is the textbook set-up eyeQ is built to flag.
None of this is a forecast. Fintech can keep running on its own narrative for a while, especially with a thesis that’s been working. But the signal is clear. Macro has tightened its grip on FINX, and what it’s saying is that these prices are running ahead of what the backdrop justifies. For anyone long on the name, that’s a signal to weigh.
Source: eyeQ. Past performance is not a guide to future performance.
Useful terminology:
Model value
Where our smart machine calculates that any stock market index, single stock or exchange-traded fund (ETF) should be priced (the fair value) given the overall macroeconomic environment.
Model (macro) relevance
How confident we are in the model value. The higher the number the better! Above 65% means the macro environment is critical, so any valuation signals carry strong weight. Below 65%, we deem that something other than macro is driving the price.
Fair Value Gap (FVG)
The difference between our model value (fair value) and where the price currently is. A positive Fair Value Gap means the security is above the model value, which we refer to as “rich”. A negative FVG means that it's cheap. The bigger the FVG, the bigger the dislocation and therefore a better entry level for trades.
Long Term model
This model looks at share prices over the last 12 months, captures the company’s relationship with growth, inflation, currency shifts, central bank policy etc and calculates our key results - model value, model relevance, Fair Value Gap.
These third-party research articles are provided by eyeQ (Quant Insight). interactive investor does not make any representation as to the completeness, accuracy or timeliness of the information provided, nor do we accept any liability for any losses, costs, liabilities or expenses that may arise directly or indirectly from your use of, or reliance on, the information (except where we have acted negligently, fraudulently or in wilful default in relation to the production or distribution of the information).
The value of your investments may go down as well as up. You may not get back all the money that you invest.
Equity research is provided for information purposes only. Neither eyeQ (Quant Insight) nor interactive investor have considered your personal circumstances, and the information provided should not be considered a personal recommendation. If you are in any doubt as to the action you should take, please consult an authorised financial adviser.
Disclosure
We use a combination of fundamental and technical analysis in forming our view as to the valuation and prospects of an investment. Where relevant we have set out those particular matters we think are important in the above article, but further detail can be found here.
Please note that our article on this investment should not be considered to be a regular publication.
Details of all recommendations issued by ii during the previous 12-month period can be found here.
ii adheres to a strict code of conduct. Contributors may hold shares or have other interests in companies included in these portfolios, which could create a conflict of interests. Contributors intending to write about any financial instruments in which they have an interest are required to disclose such interest to ii and in the article itself. ii will at all times consider whether such interest impairs the objectivity of the recommendation.
In addition, individuals involved in the production of investment articles are subject to a personal account dealing restriction, which prevents them from placing a transaction in the specified instrument(s) for a period before and for five working days after such publication. This is to avoid personal interests conflicting with the interests of the recipients of those investment articles.