How the tables turned for funds in the sell-off
Saltydog Investor looks at a shift in fortunes for two fund sectors.
14th April 2026 11:31
by Douglas Chadwick from ii contributor
This content is provided by Saltydog Investor. It is a third-party supplier and not part of interactive investor. It is provided for information only and does not constitute a personal recommendation.
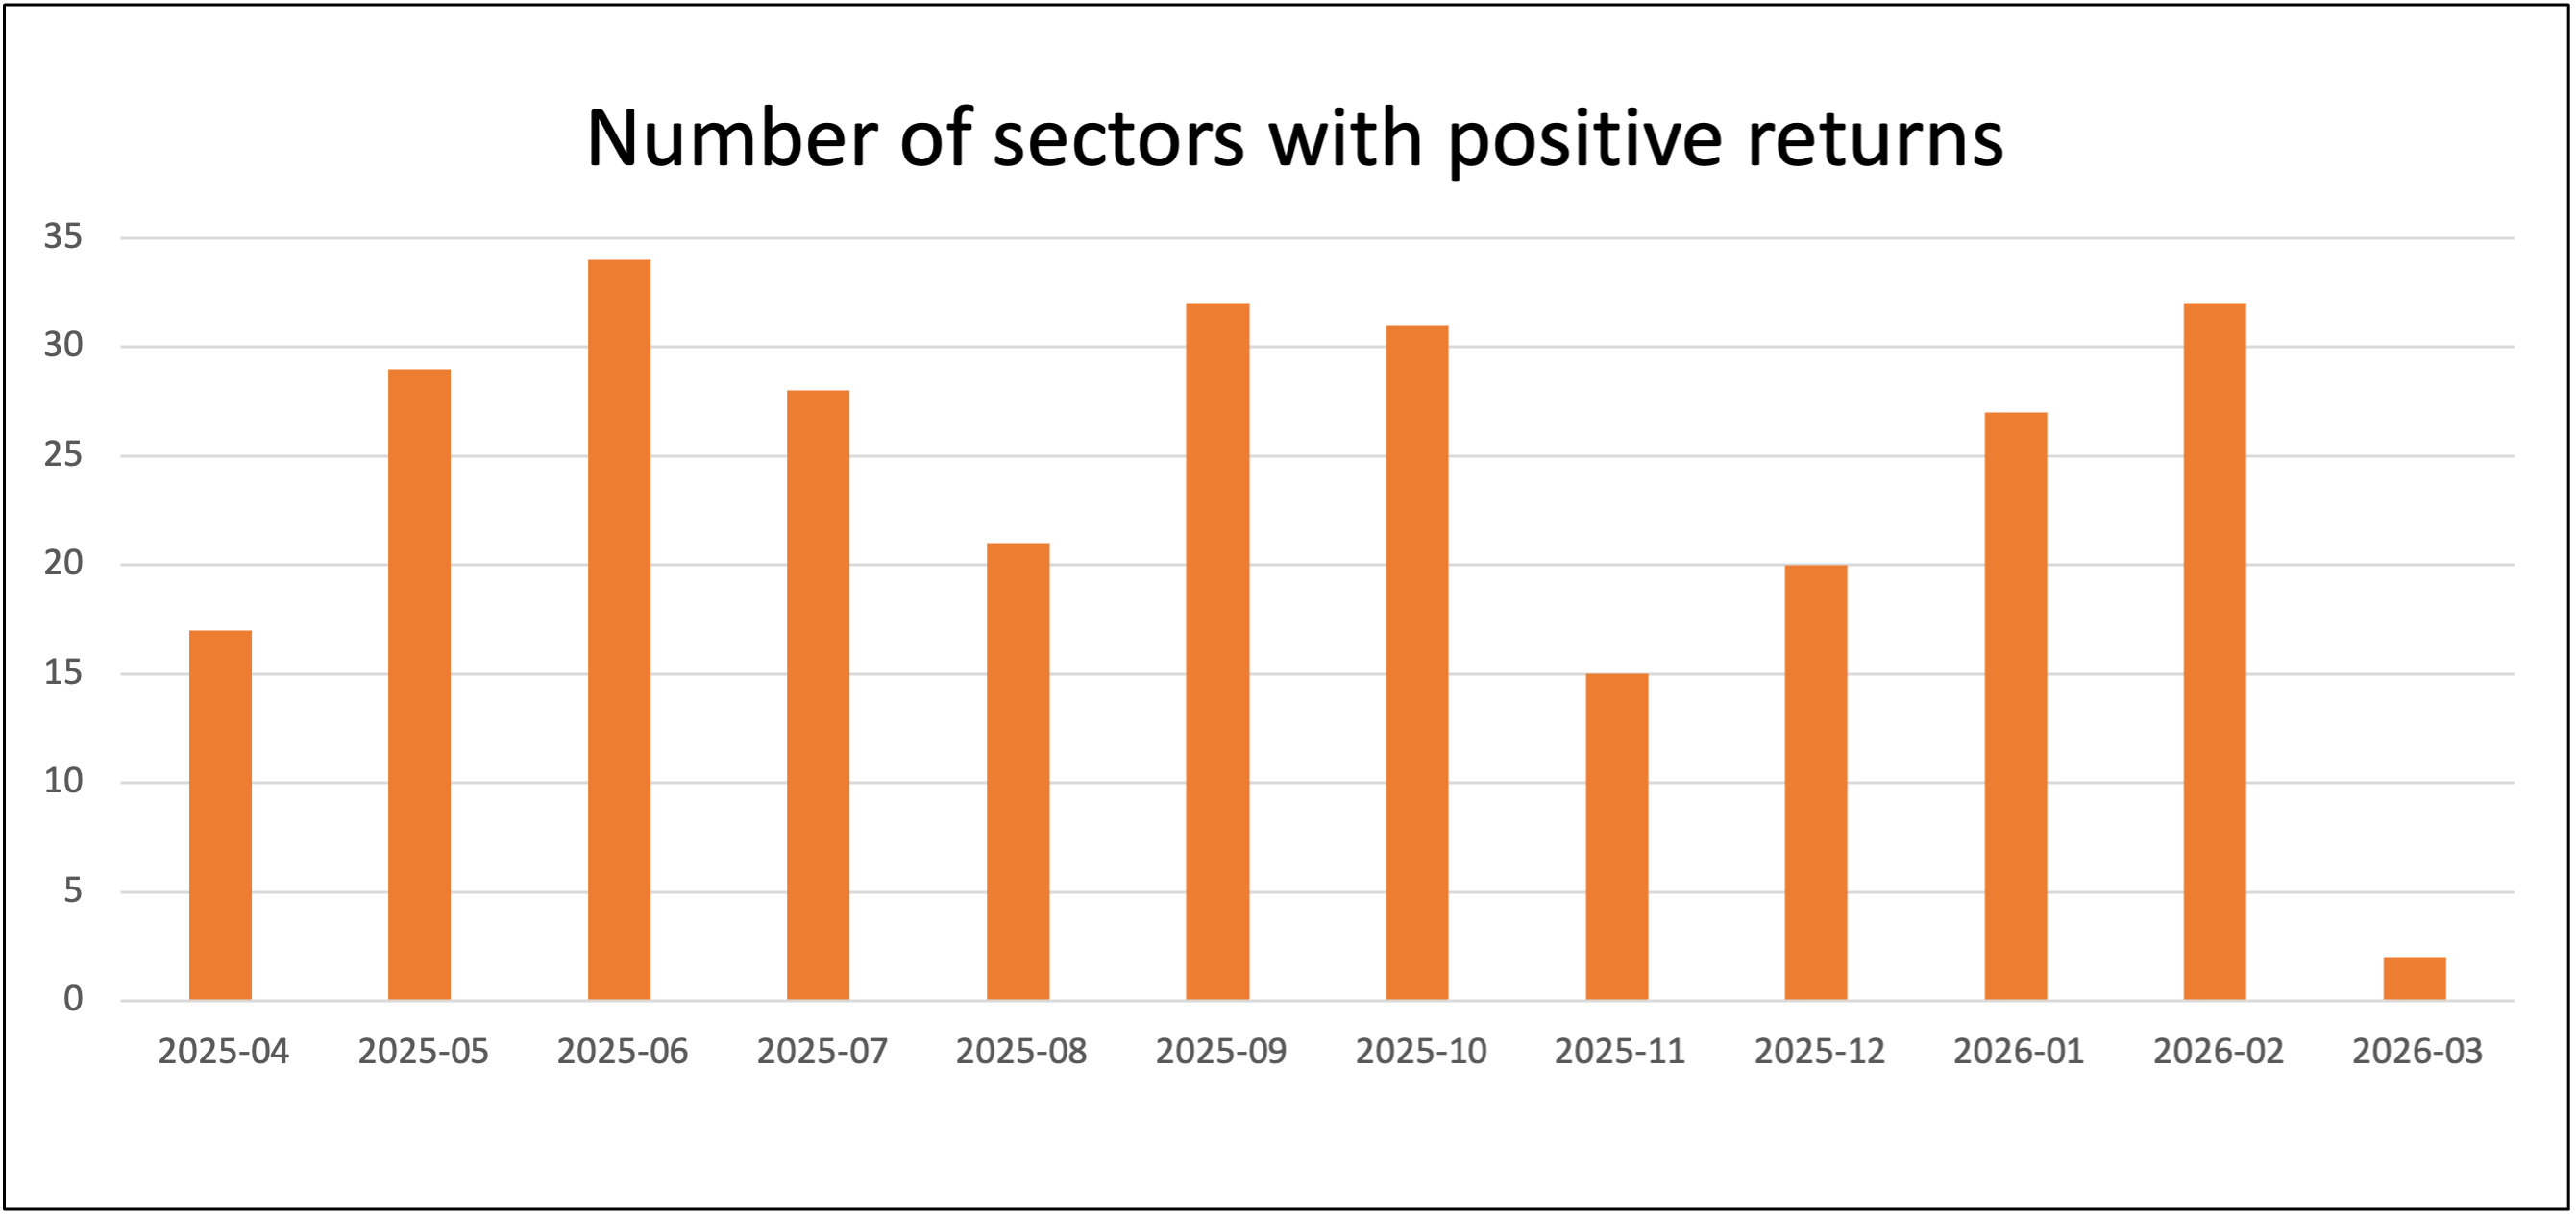
This year got off to a reasonable start, with most sectors making gains in January and February. However, due to the war in the Middle East, March ended up being the worst month we’ve seen since the outbreak of the Covid-19 pandemic.
Only two of the 34 sectors that we regularly report on went up in March – Short Term Money Market and Standard Money Market.
- Invest with ii: Top ISA Funds | FTSE Tracker Funds | Open a Stocks & Shares ISA
Past performance is not a guide to future performance.
The leading fund in January was Barings Korea I GBP Acc, with a one-month return of 25.4%, followed by the gold funds from the Specialist sector – SVS Baker Steel Gold & Precious Metals B Acc, BlackRock Gold and General D Acc, SVS Sanlam Global Gold &Resources, and Ninety One Global Gold I Acc. The WS Amati Strategic Metals B Acc fund, which also invests in companies mining and processing precious metals, was close behind.
In February, Barings Korea slipped to second place, even though it had gained a further 19.8%. The Invesco Japanese Smaller Coms UK Z Acc just edged ahead, up 20% over the month. Another four funds from the Japanese sector made it into our top 10, along with three from the Asia Pacific sector and one from China/Greater China.
After two months, the top funds were Barings Korea and the gold/strategic metals funds.
Saltydog’s leading funds in January and February 2026
| Name | Investment Association sector | Jan (%) | Feb (%) | Jan + Feb (%) |
| Barings Korea I GBP Acc | Specialist | 25.4 | 19.8 | 50.2 |
| SVS Baker Steel Gold&Precious Mtls B Acc | Specialist | 20.7 | 10.7 | 33.6 |
| WS Amati Strategic Metals B Acc | Commodities & Natural Resources | 18.0 | 9.4 | 29.1 |
| WS Ruffer Gold C Acc | Specialist | 16.2 | 11.0 | 28.9 |
| BlackRock Gold and General D Acc | Specialist | 19.4 | 7.9 | 28.8 |
| Ninety One Global Gold I Acc | Specialist | 18.2 | 8.0 | 27.6 |
Data source: Morningstar. Past performance is not a guide to future performance.
Throughout March, the US and Israel maintained air and missile attacks on Iran.
In response, Iran launched waves of ballistic missiles and drones targeting Israel, US military bases in the region, and infrastructure in the Gulf states. They also attacked tankers and restricted traffic through the Strait of Hormuz.
Stock markets around the world fell sharply, and the price of oil climbed to levels not seen since Russia’s invasion of Ukraine in 2022.
Less than 2% of the funds that we analyse made gains, and the leading funds from earlier in the year suffered some of the largest losses, falling by around 20%.
- Why these funds hold so much cash
- Sign up to our free newsletter for investment ideas, latest news and award-winning analysis
- Five ways to hit the 2026-27 tax year running
The best-performing funds were WS Guinness Global Energy I Acc, up 16.3%, Schroder ISF Global Energy A Dis GBP AV, up 15.2%, and BGF World Energy D4, up 13.9%. All three benefited from higher fuel prices and concerns over supply disruption in the Middle East.
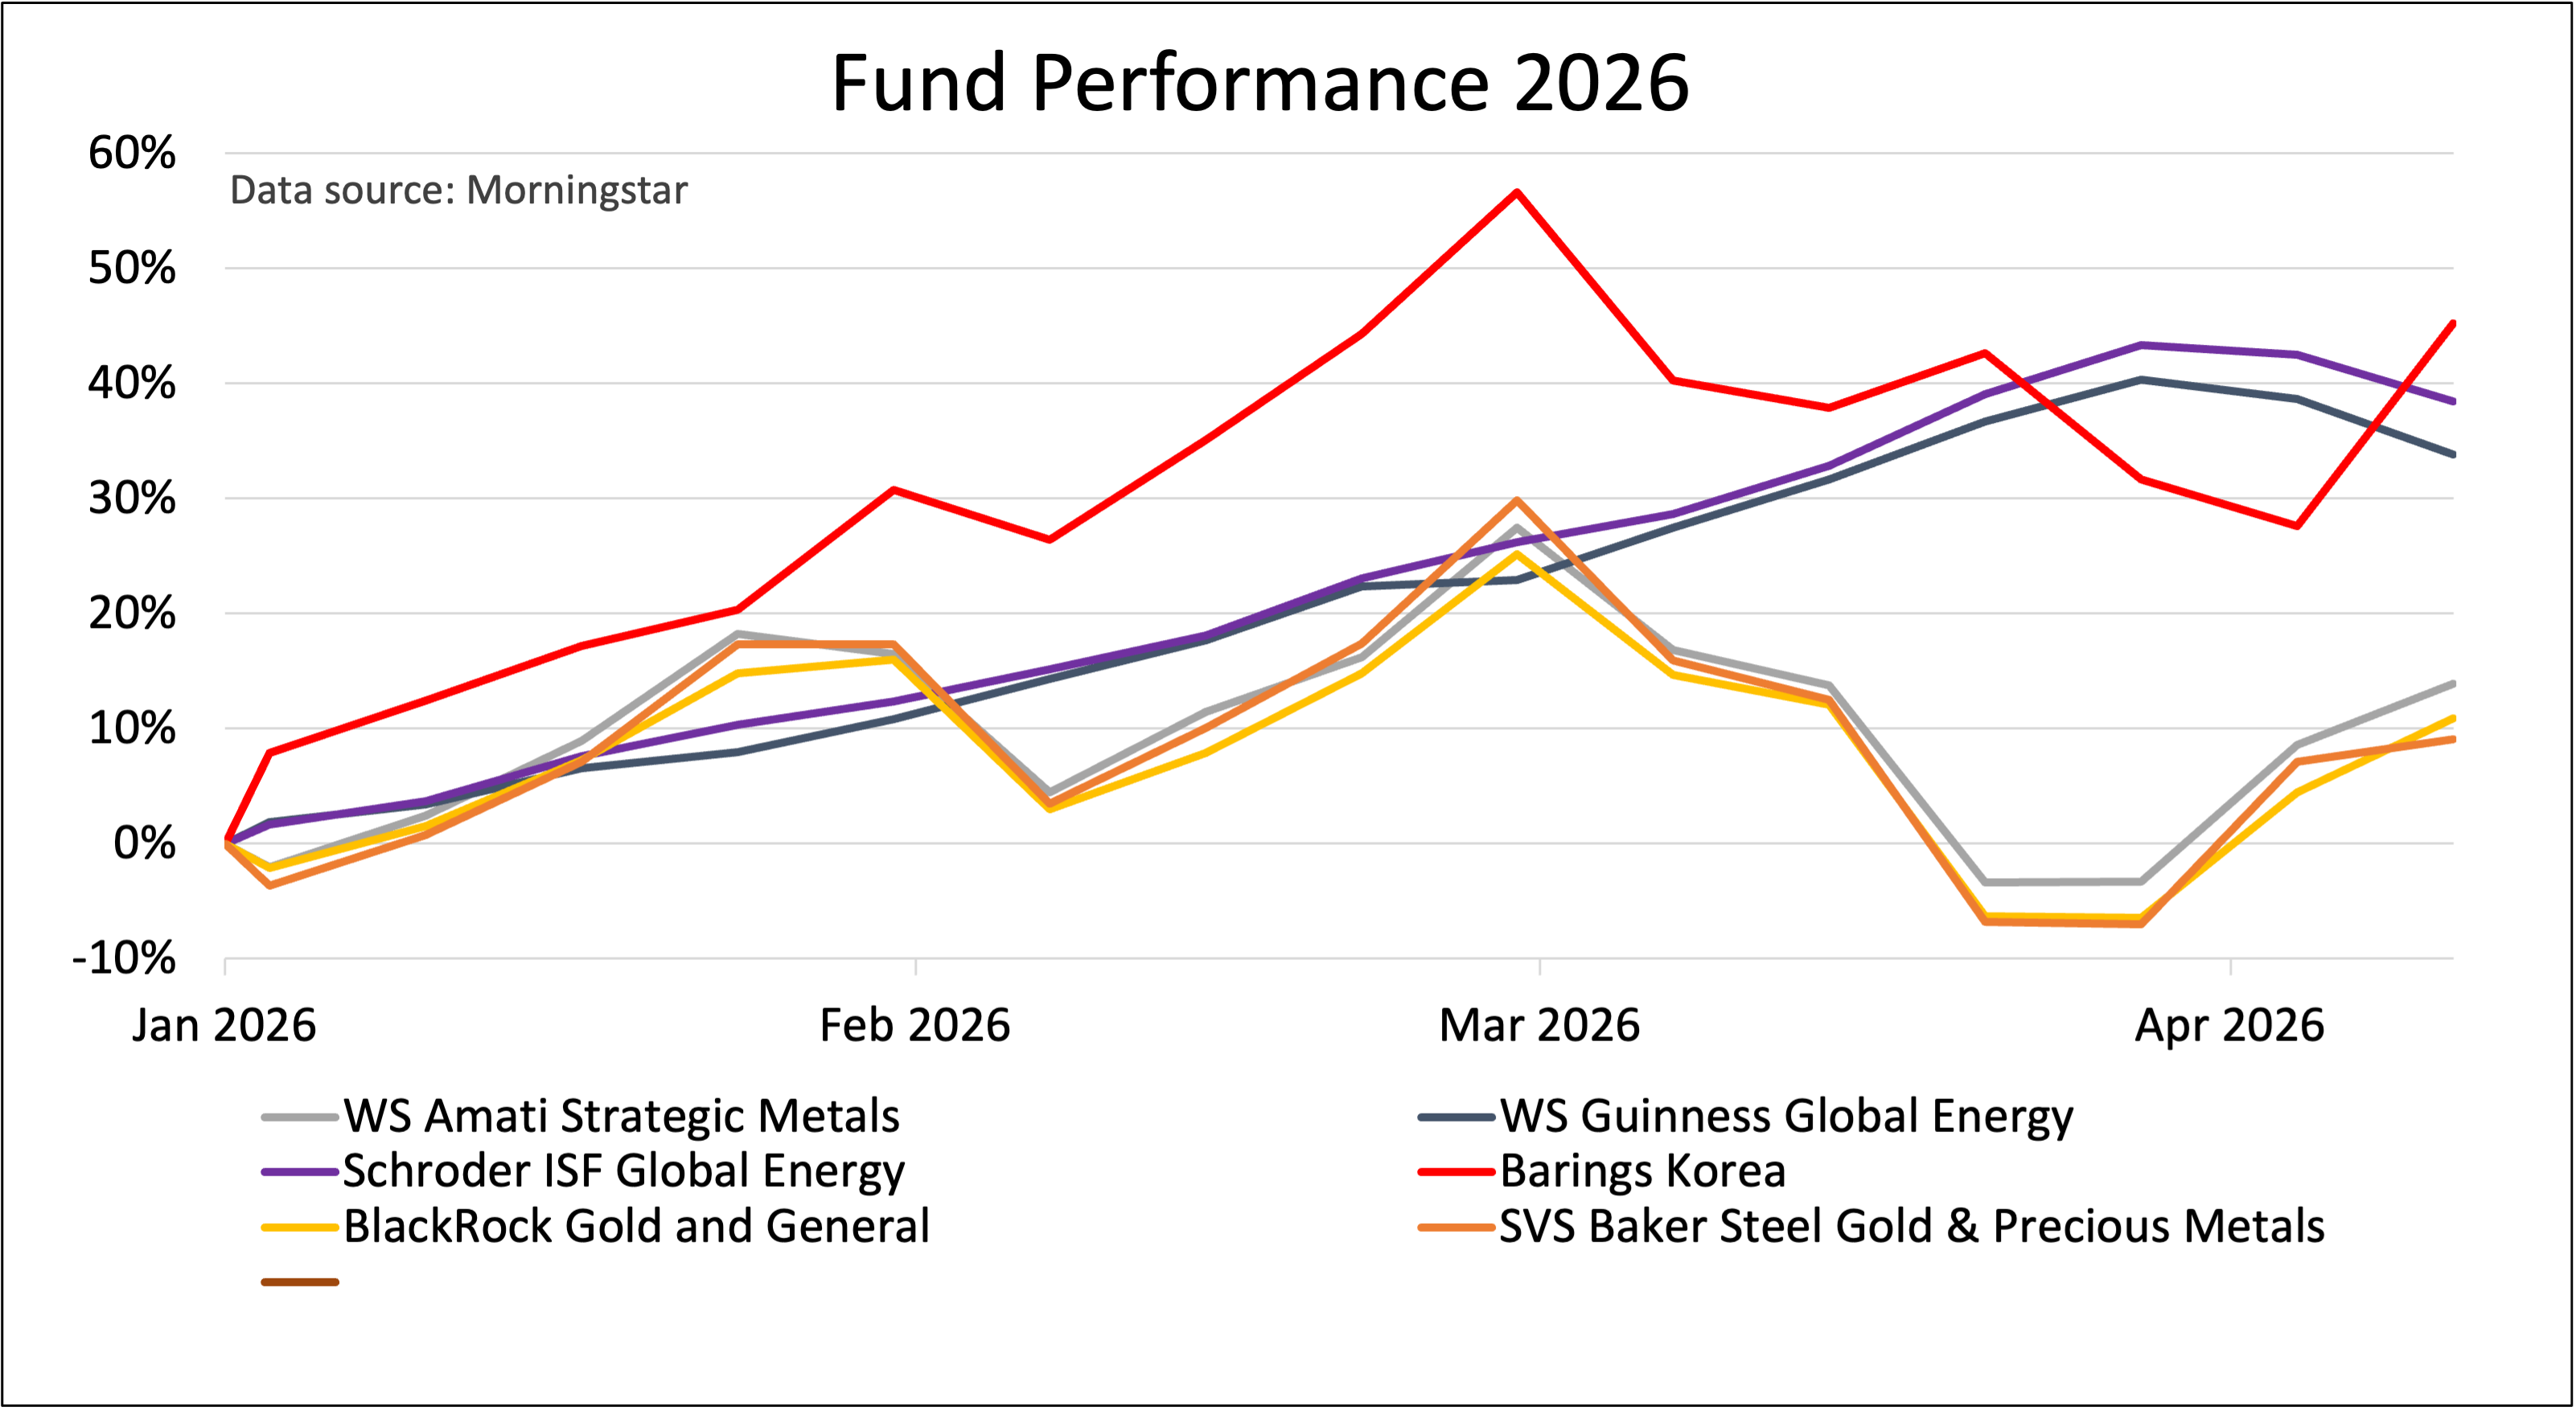
This month, we’ve seen a sharp reversal. Following the announcement of the ceasefire on 7 April, the energy funds started to fall and are currently showing month-to-date losses ranging from 4.8% to 6.4%.
On the other hand, the precious metals funds, along with Barings Korea, have rebounded strongly.
Here’s a graph showing the relative performance of two of the gold funds, two of the energy funds, WS Amati Strategic Metals, and Barings Korea.
Past performance is not a guide to future performance.
While the hostilities are put on hold, and if a lasting peace is negotiated, then the latest shift in momentum could continue, but that is a big if.
For more information about Saltydog, or to take the two-month free trial, go to www.saltydoginvestor.com
These articles are provided for information purposes only. Occasionally, an opinion about whether to buy or sell a specific investment may be provided by third parties. The content is not intended to be a personal recommendation to buy or sell any financial instrument or product, or to adopt any investment strategy as it is not provided based on an assessment of your investing knowledge and experience, your financial situation or your investment objectives. The value of your investments, and the income derived from them, may go down as well as up. You may not get back all the money that you invest. The investments referred to in this article may not be suitable for all investors, and if in doubt, an investor should seek advice from a qualified investment adviser.
Full performance can be found on the company or index summary page on the interactive investor website. Simply click on the company's or index name highlighted in the article.